
SEO KPIs are the few search numbers you tie to a business goal and give a target, like organic leads or revenue. Everything else you track is a metric that explains why those KPIs moved.
My advice: report a handful of KPIs, not every number your tools can show. Below are the metrics worth tracking, what each one tells you, where to find it and what good looks like.
One thing changed this year. Search Console now shows how often your pages appear in Google’s AI Overviews and AI Mode. It shows impressions only, so you need to read it differently from the rest of your data.
What is an SEO KPI?
A KPI (key performance indicator) is a number that tells you whether a goal was met. In SEO, it is a search metric with four things attached: the goal it serves, a target, a deadline and someone responsible for it.
Here is the difference in practice. “Organic clicks” is a metric. “Non-branded organic clicks to product pages up 30% by June” is a KPI. The first describes activity, while the second tells you whether SEO is doing its job.
It also helps to split your numbers into two groups:
- Leading indicators move first: impressions, rankings, AI impressions and new referring domains. They tell you whether you are on the right track.
- Lagging indicators prove value: conversions, revenue, pipeline and ROI. They take months to move, so judge them over quarters rather than weeks.
Visibility KPIs: are people seeing you?
These come first because they move first. If visibility isn’t growing, traffic and sales won’t follow.
1. Organic impressions
Impressions count how often your pages showed up in Google’s results, clicked or not. They are the earliest sign that new content is being found, often weeks before traffic moves.
You’ll find them in Google Search Console under Performance. Because the number comes straight from Google, a client or manager can check it without trusting your tools.
What good looks like: impressions growing for the topics you target, compared with the same period last year.
2. Organic clicks and click-through rate
Clicks are the visits Google sends you. Click-through rate (CTR) is clicks divided by impressions, so it tells you how often people pick your result once they see it.
Both sit next to impressions in Search Console. A falling CTR while impressions rise usually means your titles aren’t earning the click, or the results page is answering the question before anyone scrolls.
What good looks like: for a whole site, a good CTR usually sits between 1% and 2%. That range depends heavily on how strong the site is, which the benchmark section below explains.
3. Keyword rankings
Rankings show where your pages sit for the keywords you care about. Track a fixed list in a rank tracker such as Ahrefs or Semrush so each month compares like with like.
Don’t use Search Console’s site-wide average position as a KPI. It averages every query a page shows for, so a page can gain traffic while its average position drops. Read it per page or per group of queries instead.
What good looks like: more of your target keywords in the top 3 and top 10 than last quarter.
4. AI Overview and AI Mode impressions
This is the newest number on the list. Search Console’s Generative AI performance report shows how often links to your site appeared in Google’s AI Overviews and AI Mode.
It matters because more answers now appear on the results page itself. A page can lose clicks while gaining visibility inside the AI answer. This report is where Google shows you that.
What good looks like: your key pages earning AI impressions over time. There is no outside benchmark yet, so compare against your own starting point. What this report does and doesn’t show is covered further down.
5. AI referral visits
People also find sites through ChatGPT, Perplexity, Gemini and other AI assistants. Those visits show up in Google Analytics 4 as referral traffic from sites such as chatgpt.com and perplexity.ai.
Track them separately from organic search. The numbers are usually small, but they show which pages AI tools recommend. Check how many of those visits convert before you decide how much weight to give them.
What good looks like: growth from your own baseline, read together with the conversions those visits bring.
Traffic and engagement KPIs: are the right people arriving?
Visibility only counts if it brings the right visitors. These three tell you who is arriving and whether they stay.
6. Organic sessions
Sessions are the visits Google Analytics 4 records from organic search. Find them under Reports, then Acquisition, then Traffic acquisition, filtered to Organic Search.
They should roughly follow your Search Console clicks. If the two drift far apart, check your tracking before you report either number.
What good looks like: up year over year on the pages that matter to the business.
7. Branded vs non-branded clicks
Branded clicks come from people searching your company or product name. Non-branded clicks come from people who didn’t know you yet and found you through a topic.
Non-branded growth is the clearest sign that SEO is creating new demand. Branded growth says more about PR, ads and word of mouth. Search Console can now split the two for you, with one catch explained below.
What good looks like: non-branded clicks growing faster than branded ones.
8. Engagement rate
Engagement rate is the share of visits that were engaged. According to Google’s GA4 help page on engagement rate, a session counts as engaged when it lasts longer than 10 seconds, has a key event or has 2 or more page views.
You may still see bounce rate in older reports. In GA4 it is simply the opposite: the share of sessions that were not engaged. Report one of them, not both, because together they show the same thing twice.
What good looks like: set a baseline for each page type. A pricing page and a glossary post do different jobs, so they shouldn’t share a target.
Business KPIs: is SEO making money?
These are the numbers a business owner or client renews on. They move last, which is why they need patience.
9. Organic conversions and conversion rate
Conversions are the actions that matter to you: a sale, a demo request, a sign-up or a call. Conversion rate is conversions divided by organic sessions.
In GA4, mark those actions as key events, then filter them to Organic Search. This is usually the number a business owner cares about most, because it connects search to leads.
What good looks like: targets set from your own last 12 months. Conversion rates vary so much by page type that an industry average tells you very little.
10. Revenue, pipeline and SEO ROI
Revenue is what organic visitors spent. For B2B companies with long sales cycles, pipeline from your CRM is a better measure, because a demo request can take weeks to become a deal.
SEO ROI puts the two sides together: organic revenue minus SEO cost, divided by SEO cost, times 100. Use the full monthly cost, including any agency fee. My breakdown of what SEO costs covers typical ranges.
What good looks like: positive and rising, reported quarterly. Revenue usually takes months to respond to SEO, so a monthly ROI figure will mislead you early on.
Health KPIs: is anything holding you back?
You won’t report these every month. Check them often anyway, because a problem here can quietly undo everything above.
11. New referring domains
Referring domains are the separate websites that link to you. New ones each month show whether your content is earning attention from other sites.
Track new referring domains in Ahrefs or Semrush rather than total backlinks, since one sitewide link can add thousands of backlinks from a single site. Scores such as DR and DA are estimates made by those tools, not Google metrics; my guide to domain authority explains the difference. To catch lost links between reports, use the routine in how to monitor backlinks.
What good looks like: more relevant sites linking to you each month than you lose.
12. Core Web Vitals and indexed pages
These two are health checks. Core Web Vitals measure loading, responsiveness and visual stability. Google’s web.dev sets “good” at an LCP of 2.5 seconds or less, an INP of 200 milliseconds or less and a CLS of 0.1 or less, measured at the 75th percentile of page loads. If a report template still shows FID, it is out of date: INP replaced it in 2024.
Indexed pages, in Search Console’s Page indexing report, show whether the pages you want found are actually in Google. A sudden drop there can explain a traffic drop before you look anywhere else.
What good looks like: your key page templates passing Core Web Vitals, with no unexplained drop in indexed pages.
Search Console’s AI report shows impressions, not clicks
Google’s help page for the report says: “As of August 31, 2026, we’ve rolled out these insights to all websites worldwide.” It covers AI Overviews and AI Mode. Impressions are “how many times links to your site were shown to a user in a generative AI feature on Google Search.”
What it leaves out matters just as much. The help page describes impressions only, with no clicks, CTR or position. The report may not appear at all for a site that hasn’t had enough AI impressions yet.
Here is how to use it:
- Add AI impressions per page to your monthly report. The number comes from Google, not a third-party estimate.
- Don’t promise anyone an “AI Overview clicks” figure from Search Console. It isn’t in the report.
- Pair it with AI referral visits from GA4. Pages with plenty of AI impressions but few visits need a stronger reason to click, such as original data, a free tool or a clear next step.
Why branded and non-branded clicks won’t add up to your total
Search Console’s branded query filter is the easiest way to split the two. Its help page lists three limits: it “isn’t available for sites with a low number of impressions”, its history starts in March 2025 and “some queries might be incorrectly identified as branded or non-branded.”
There is a bigger catch. Google hides some rare searches for privacy. Google’s help page for the same filter says these anonymized queries are “included in chart totals, unless a query filter is applied.” The branded split works as a query filter. So once you apply it, those hidden searches can drop out of the count.
The result: branded plus non-branded clicks can come out lower than your total clicks. Report the difference as “unclassified” so nobody thinks traffic went missing. My long-tail keywords post explains how anonymized queries affect your Search Console data.
How to tell a real SEO benchmark from a made-up one
A benchmark without a method is just a number. You’ll see targets for bounce rate, session length or conversion rate quoted with no study behind them. A number like that can’t tell you whether you’re failing.
Before you trust one, ask three questions: who measured it, across how many sites and when? If any answer is missing, use your own baseline instead.
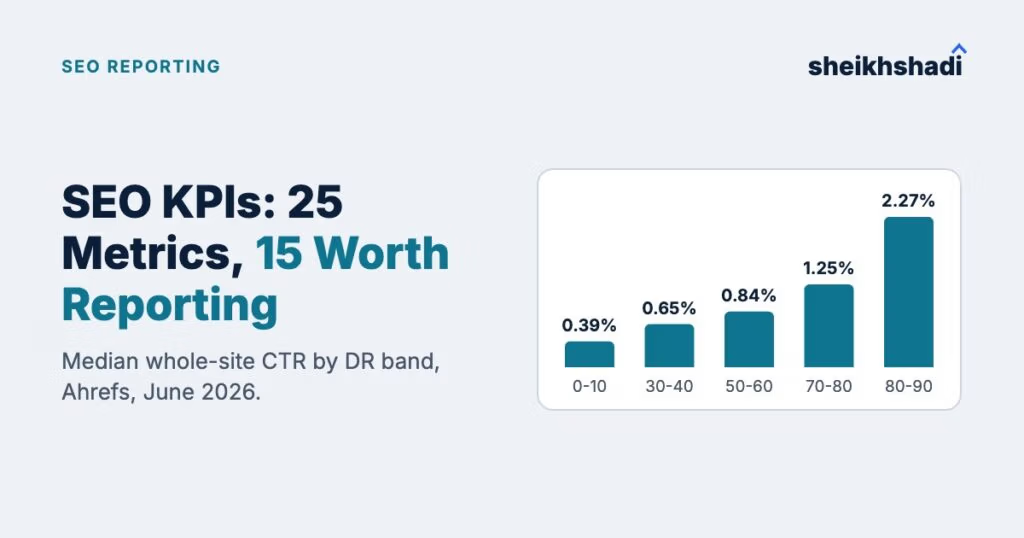
Two kinds of benchmark pass that test. The first is Google’s own thresholds, such as the Core Web Vitals limits above. The second is a large study with a stated method. Ahrefs’ CTR study used Search Console data from 422,421 websites and found that “for a whole website, a good organic CTR usually falls between 1% and 2%”.
The same study shows why one number doesn’t fit every site. Median CTR rises with the site’s Domain Rating:
| Ahrefs DR band | Median whole-site CTR (Ahrefs, 2026) |
|---|---|
| 0 to 10 | 0.39% |
| 30 to 40 | 0.65% |
| 50 to 60 | 0.84% |
| 70 to 80 | 1.25% |
| 80 to 90 | 2.27% |
So a DR 35 site with a 0.7% CTR is above its band’s median, not failing. For engagement rate, conversion rate and traffic growth, set targets from your own last 12 months and say so in the report.
How do you measure the success of an SEO campaign?
Measure it against the goal you set before it started. Write that goal down first, whether it’s more leads, more sales or more sign-ups from search. Then pick one or two lagging KPIs that prove it and three or four leading ones that show progress along the way.
Give it time. In my experience, the leading numbers move within the first few months, while revenue and pipeline need about six months before you can judge them fairly. If they haven’t moved by then, the report should say so and explain why.
Which 3 to 5 SEO KPIs should you report?
It depends on how your business makes money. These are the sets I’d start with:
| Business type | KPIs to report |
|---|---|
| Online store | Organic revenue, organic conversion rate, non-branded clicks |
| B2B or SaaS | Organic demo or trial requests, pipeline from organic, non-branded clicks, AI impressions |
| Content or media site | Organic sessions, engagement rate, AI impressions, AI referral visits |
Everything else on the list stays on your own monitoring sheet. Look at it weekly, but only bring it into the report when it explains why a KPI moved.
If you report to clients: put the goal and the KPIs on page one, with leading indicators, work done and next month’s plan behind them. In the first three months, lead with impressions, rankings and AI impressions. From month six, lead with conversions and revenue.
SEO KPI cheat sheet
| KPI | Where to find it | Report or monitor |
|---|---|---|
| Organic impressions | Search Console, Performance | Report |
| Organic clicks and CTR | Search Console, Performance | Report |
| Keyword rankings | Ahrefs or Semrush rank tracker | Report |
| AI Overview and AI Mode impressions | Search Console, Generative AI performance | Report |
| AI referral visits | GA4, session source | Monitor |
| Organic sessions | GA4, Traffic acquisition | Monitor |
| Branded vs non-branded clicks | Search Console, branded query filter | Report |
| Engagement rate | GA4, Pages and screens | Monitor |
| Organic conversions and rate | GA4, key events filtered to Organic Search | Report |
| Revenue, pipeline and ROI | GA4 ecommerce or your CRM | Report (ROI quarterly) |
| New referring domains | Ahrefs or Semrush | Monitor |
| Core Web Vitals and indexed pages | Search Console | Monitor |
My verdict: track many numbers, report a few
Track all twelve if it helps you, but only report the ones tied to money. For most businesses that means organic conversions plus revenue or pipeline. Add non-branded clicks to show new demand. Add AI impressions now that Google reports them.
This approach suits any business that sells online or collects leads through its site. It suits less well someone who wants one traffic number every week. If that’s your boss or client, agree on the KPIs up front so the report answers the right question.
Want a second opinion on which of these numbers your site should be moving? Get a free SEO audit and we’ll show you where to start.