
Imagine running a successful local business, confident you’re ranking well in Google searches. Then you discover a shocking truth: potential customers just three blocks away can’t find you when they search for your services. This reality hits thousands of business owners daily.
Local SEO heat maps solve this exact problem. They provide X-ray vision for your local search performance, revealing exactly where you dominate and where you’re completely invisible to customers. Instead of guessing your search visibility, you get a colorful, data-driven map showing your true market reach.
This comprehensive guide covers everything about local SEO heat maps: what they are, how to interpret them, and proven strategies to dominate your local market. Let’s transform your local search visibility.
What Is a Local SEO Heat Map?
A local SEO heat map visually represents your business’s search ranking performance across different geographical locations. Think of it like a weather map, but instead of showing temperature, it displays how well your business ranks in Google searches from various locations around your city.
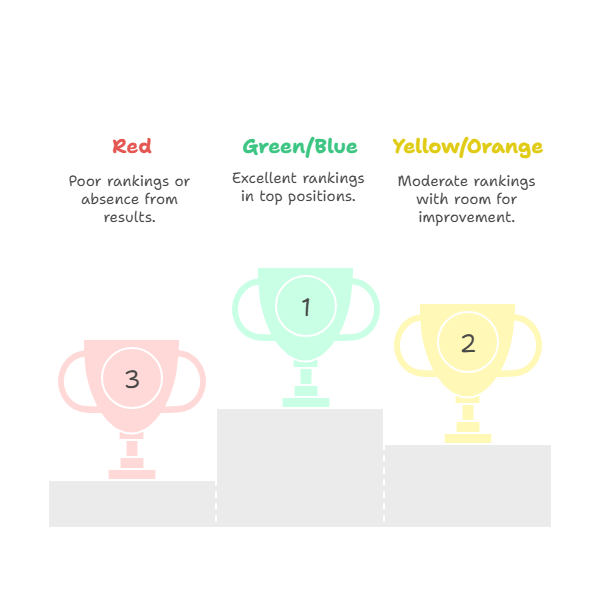
The map uses intuitive color coding to represent ranking positions. Typically, green or blue areas indicate excellent performance (positions 1-3), yellow represents moderate performance (positions 4-10), and red shows poor visibility or no ranking at all.
Heat maps reveal the hidden truth about local visibility. You might rank number one when searching from your office, but customers five miles away might not see you anywhere. This happens because Google considers the searcher’s exact location when delivering results, creating invisible boundaries around your digital presence.
How Heat Maps Work for Local Search
Local SEO heat maps function by simulating searches from hundreds of GPS coordinates around your target area. Advanced tools can perform thousands of searches from different locations, creating a comprehensive picture of your true visibility.
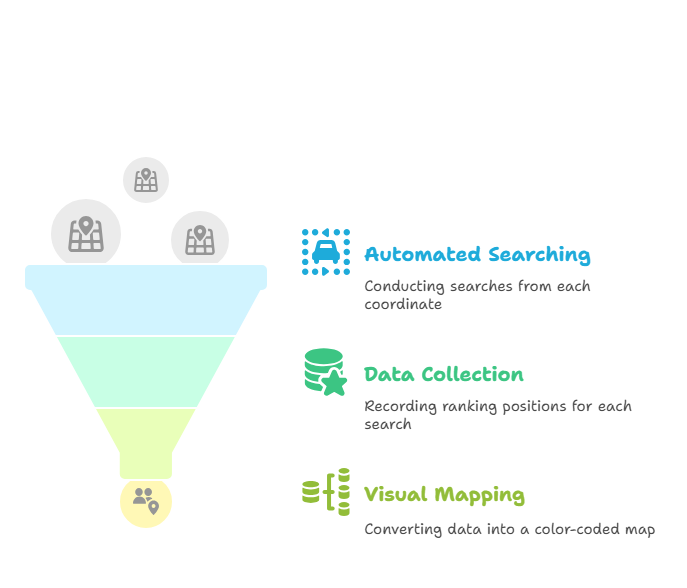
The technical process involves:
- Grid Setup: Creating a network of GPS coordinates around your business location
- Automated Searching: Performing searches for target keywords from each coordinate point
- Data Collection: Recording ranking positions for every search location
- Visual Mapping: Converting raw data into color-coded geographic representations
Modern heat map tools track both Google Business Profile listings and organic website rankings simultaneously. They can also differentiate between mobile and desktop results, revealing device-specific ranking patterns that often vary significantly.
Why Heat Maps Matter for Local Businesses
Local search success isn’t just about being found – it’s about being discovered by the right customers in the right locations. Heat maps help you understand your true market reach and identify high-value opportunities you’re missing.
Consider this real scenario: A restaurant owner believes they’re dominating local search because they rank first when searching from their location. However, their heat map reveals complete invisibility in an affluent neighborhood two miles north. That represents massive missed revenue from higher-value customers.
Heat maps also provide competitive intelligence. You might dominate the immediate area around your business while competitors crush you in surrounding neighborhoods. Without heat map data, you’d never know to focus optimization efforts on those specific areas.
Top Benefits of Using Local SEO Heat Maps
Visualizing Your Local Visibility
The primary advantage of heat maps is transforming complex ranking data into instantly understandable visuals. Instead of analyzing spreadsheets filled with numbers, you get immediate visual feedback showing exactly where you’re strong and where improvement is needed.
This visual approach proves invaluable when working with clients or team members without SEO expertise. Show them a heat map and they immediately grasp the situation. Red areas need improvement. Green areas show success. The simplicity drives better decision-making and stakeholder buy-in.
Visual data also reveals patterns invisible in raw numbers. Maybe you’re consistently weak north of your business but strong to the south. This pattern might indicate specific optimization opportunities or reveal important insights about local market dynamics.
Understanding Geographic Performance
Heat maps reveal the geographic nuances of local search that most businesses never discover. You might find that visibility drops dramatically in certain directions from your business, or discover unexpected “dead zones” where you’re completely absent from search results.
This geographic insight directly impacts marketing strategy effectiveness. Knowing you’re weak in a particular neighborhood allows you to focus Google Ads spending there, launch targeted social media campaigns, or adjust your service area marketing.
Heat maps also clarify the relationship between distance and rankings. While businesses typically rank better closer to their physical location, heat maps show your exact visibility radius and help you strategically expand it.
Uncovering Keyword and Location Gaps
Different keywords produce dramatically different heat map results for the same business. You might rank excellently for “pizza delivery” but poorly for “Italian restaurant” despite both terms being highly relevant. Heat maps identify these keyword-specific gaps with precision.
Location gaps prove equally valuable. Perhaps you rank well for searches including your city name but poorly for neighborhood-specific searches or local landmark references. Heat maps expose these location-specific opportunities clearly.
These insights enable targeted content and optimization strategies. If you’re weak for “downtown pizza” searches but strong for general “pizza” searches, you know exactly where to focus content creation efforts.
Improving Client Reporting for Agencies
For SEO agencies, heat maps provide unparalleled client reporting value. They offer clear, visual proof of campaign impact. Instead of explaining ranking improvements through charts and graphs, you can show dramatic before-and-after heat map transformations.
Clients immediately understand heat map value. When you show areas transforming from red to green over time, they clearly see how your efforts directly expand their market reach and potential customer base.
Heat maps also help set realistic client expectations. If a client expects to rank first everywhere, you can show the current competitive landscape and explain why certain areas present greater challenges.
How to Read a Local SEO Heat Map
Color Indicators and Ranking Numbers
Reading heat maps becomes intuitive once you understand the color system. Most tools use a traffic light approach for clarity:
- Green/Blue: Excellent rankings (positions 1-3) – these represent your highest-value zones
- Yellow/Orange: Moderate rankings (positions 4-10) – visible but not optimal performance
- Red: Poor rankings (position 11+) or completely absent from results
Advanced tools display exact ranking numbers on each data point, providing more precise information. Position 4 differs significantly from position 10, even though both might appear yellow on the map.
Pay close attention to color clustering patterns. Green clusters surrounded by red might indicate very localized ranking boosts you could potentially expand. Isolated red spots within green areas might signal specific technical issues or intense local competition.
Radius Zones: Urban vs. Rural Nuances
Heat map interpretation varies significantly between urban and rural environments. In dense urban areas, visibility might drop within just a few blocks due to intense competition. Rural businesses often maintain strong rankings across much larger distances.
Urban heat maps typically show fragmented patterns because of numerous competing businesses and complex local ranking signals. You might rank excellently in one neighborhood but poorly in an adjacent area due to local competition or different search behaviors.
Rural heat maps usually display more gradual transitions from strong to weak rankings as distance increases from the business location. However, they might reveal unexpected dead zones where geographic features or dominant competitors impact visibility.
Mobile vs. Desktop Heat Map Differences
Mobile and desktop heat maps can look completely different for identical businesses and keywords. Mobile searches often carry stronger local intent and may show different results based on user movement patterns and behavior.
Mobile heat maps frequently display stronger rankings closer to business locations, as mobile users actively seek nearby services. Desktop heat maps might show more consistent rankings across wider areas, since desktop users often research before visiting.
Understanding these differences proves crucial for optimization strategy. Strong mobile rankings but weak desktop performance in certain areas might indicate well-optimized Google Business Profiles but websites needing improvement for location-based searches.
How to Use Heat Map Data to Improve Local Rankings
Spot and Target Weak Zones
The first step in leveraging heat map data involves identifying weak zones – red and yellow areas where visibility suffers. However, don’t just focus on the largest problem areas; look for strategic opportunities that offer quicker wins.
Sometimes small red zones surrounded by green areas represent immediate opportunities. Maybe a local competitor dominates that specific area, or perhaps a simple technical issue affects rankings there. These isolated weak spots often prove easier to address than large problematic regions.
When prioritizing weak zones, consider the business value of each area. A red zone in a high-income neighborhood might deserve more attention than a larger red zone in an area with limited business potential. Combine heat map data with demographic information for smart prioritization.
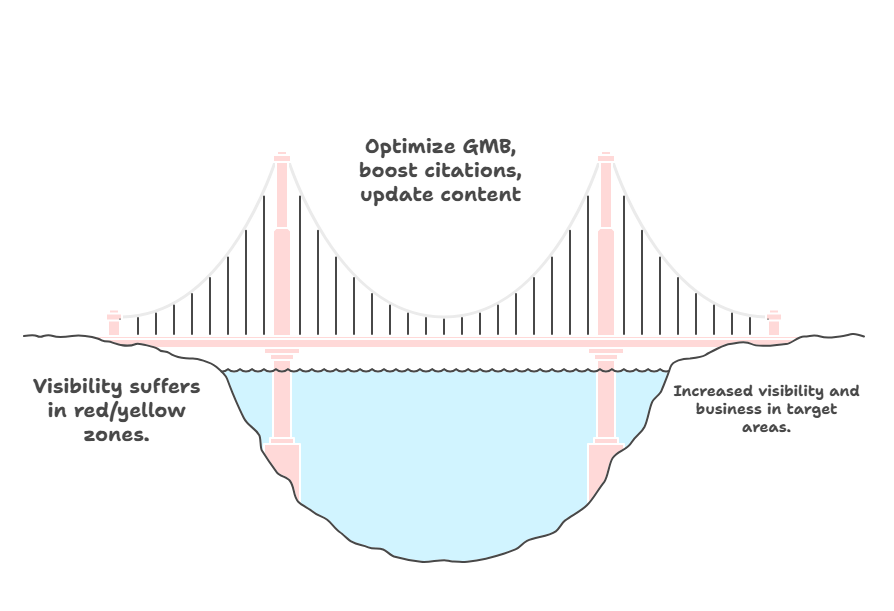
Optimize Your GMB (Google Business Profile)
Your Google Business Profile often represents the most important factor in local search rankings, and heat map data should guide optimization efforts. When you identify weak performance areas, focus on these key optimization areas:
Ensure your business information maintains complete accuracy and consistency. Any inconsistencies in name, address, or phone number can damage rankings, especially in competitively tight areas.
Add location-specific content to your GMB profile strategically. If heat maps show weakness in particular neighborhoods, create posts mentioning those areas specifically. Share photos taken in or around those neighborhoods, and encourage customers from weak zones to leave reviews.
Leverage the GMB Questions and Answers feature strategically. Answer questions using location-specific language, and encourage satisfied customers from weak zones to ask and answer questions about your services in their areas.
Boost Citations and Reviews in Low-Performing Areas
Citations (mentions of your business name, address, and phone number on other websites) play crucial roles in local rankings. When you identify weak zones through heat maps, focus citation building efforts on websites relevant to those specific areas.
Target local directories, community websites, and business associations serving areas where you’re underperforming. Citations from neighborhood association websites or local chambers of commerce can significantly impact rankings in those specific areas.
Reviews prove equally important, but here’s a strategy most businesses overlook: encourage reviews from customers in weak zones. If heat maps show struggles in the north part of town, make extra efforts to secure reviews from customers living or working there. Google considers reviewer location when determining local rankings.
Update Location-Specific Content and Keywords
Website content should reflect areas where you want to achieve strong rankings. If heat maps reveal weak performance in specific neighborhoods or districts, create content targeting those areas specifically.
This doesn’t mean stuffing your homepage with every neighborhood name in your city. Instead, create dedicated service pages or blog posts naturally mentioning these areas. For example, if you’re a plumber with weak “Riverside District” rankings, create a page about “Plumbing Services in Riverside District” with genuine, helpful content.
Include local landmarks, street names, and area-specific information in your content naturally. If people in weak areas commonly search for “plumber near Central Park” and there’s a Central Park in your target zone, ensure you have content including that landmark reference.
AI and Automation in Local SEO Heat Maps
How AI Is Enhancing Local Search Tools
Artificial intelligence is revolutionizing heat map functionality, making tools more accurate and insightful than ever before. Modern AI-powered platforms analyze patterns in heat map data and provide intelligent improvement recommendations.
AI identifies subtle patterns humans might miss. For example, it might notice rankings consistently dropping in high foot traffic areas during specific times, or performance varying based on local events or seasonal patterns.
Machine learning algorithms can predict how local SEO strategy changes might affect heat map results. This predictive capability helps you make smarter decisions about where to focus optimization efforts for maximum impact.
Automated Rank Tracking and Reporting Features
Manual ranking checks from different locations are now obsolete. Modern heat map tools automatically track performance across hundreds of locations and update heat maps in real-time, providing continuous visibility into your local search presence.
Automated reporting features alert you when rankings change significantly in specific areas. If you suddenly drop from position 2 to position 8 in a key neighborhood, you’ll receive immediate notifications and can investigate the cause quickly.
Some advanced tools provide automated competitor analysis, showing how your heat map performance compares to competitors in identical areas. This competitive intelligence reveals opportunities and threats you might otherwise miss completely.
Smart Suggestions Based on Heat Map Behavior
The most advanced heat map platforms now offer AI-powered suggestions based on your specific heat map patterns. These intelligent recommendations might include:
- Keyword Targeting: Specific keywords to target in weak performance areas
- Citation Opportunities: Optimal locations for new business listings or citations
- Content Strategies: Content topics that could improve performance in specific zones
- Competitive Analysis: Competitor strategies potentially affecting your rankings
These smart suggestions save significant time and ensure you focus on strategies most likely to improve heat map results. Instead of guessing what might work, you receive data-driven recommendations tailored to your specific situation and market.
Top Local SEO Heat Map Tools in 2025 (With Comparison)
Comparison Table: Features, Pricing, Best Use Cases
| Tool | Starting Price | Grid Points | Best For | Key Features |
|---|---|---|---|---|
| BrightLocal | $29/month | 100-625 | Agencies | White-label reports, competitor tracking |
| Local Falcon | $27/month | 100-2500 | Single locations | Real-time tracking, intuitive interface |
| GeoGrid | $49/month | Up to 5000 | Enterprise | Custom grid sizes, API access |
| GMB Radar | $39/month | 100-1000 | Multi-location | GMB-focused, review tracking integration |
BrightLocal vs. Local Falcon vs. GeoGrid vs. GMB Radar
BrightLocal serves as the premier choice for agencies and consultants. Its white-label reporting features make it perfect for client presentations, and the platform includes comprehensive competitor analysis. The interface maintains professionalism and data reliability, though pricing can be steep for single-location businesses.
Local Falcon offers exceptional value for small businesses focusing on single locations. The tool features incredible user-friendliness with an intuitive interface making heat map data easy to understand. The real-time tracking capability is particularly impressive, showing ranking changes as they occur.
GeoGrid targets enterprise-level businesses with complex requirements. It offers maximum customization options and handles large-scale tracking across multiple cities and regions effectively. API access makes it perfect for businesses wanting to integrate heat map data into existing systems.
GMB Radar specializes specifically in Google Business Profile performance, making it ideal for businesses concentrating on local pack rankings. It includes review tracking and GMB optimization suggestions alongside comprehensive heat map data.
Which Tool is Best for You?
Choosing the optimal heat map tool depends on your specific needs and budget constraints. Here’s a practical recommendation framework:
Choose BrightLocal if: You’re an agency or consultant requiring professional reporting features and managing multiple clients. The white-label capabilities and comprehensive feature set justify the higher investment.
Choose Local Falcon if: You’re a single-location business owner wanting the best feature-to-affordability ratio. The tool provides sufficient power for most needs while remaining accessible for beginners.
Choose GeoGrid if: You’re managing multiple locations across different cities or need advanced customization options. The higher price point makes sense for enterprise-level requirements.
Choose GMB Radar if: Your primary focus centers on Google Business Profile optimization and you want specialized expertise in that area. It’s particularly valuable for businesses in highly competitive local markets.
Local Algorithm Updates That Impact Heat Map Rankings
Proximity and Behavioral Signals
Google’s local algorithm heavily weighs proximity – how close your business sits to the searcher’s location. However, proximity extends beyond simple physical distance. Google also considers behavioral signals like where people actually visit after searching.
If customers consistently drive past closer competitors to visit your business, Google interprets this as a signal that your business offers more relevance or value. This can cause heat maps to show stronger rankings in areas farther from your location than expected based on distance alone.
Understanding these behavioral signals helps explain heat map patterns that might seem confusing initially. If you’re seeing unexpectedly strong rankings in areas distant from your business, it might be because customers from those areas frequently visit you, creating positive behavioral signals.
Importance of NAP Consistency
NAP consistency (Name, Address, Phone number) remains one of the most critical factors in local search rankings. Inconsistencies can create “holes” in your heat map where rankings suddenly drop in specific areas without apparent reason.
This proves particularly important for businesses with multiple locations or those that have relocated recently. If outdated address information still circulates on some websites, it can confuse Google’s algorithm and damage rankings in unpredictable ways.
Regular NAP audits are essential for maintaining consistent heat map performance. Use specialized tools to scan the web for business mentions and ensure all information remains accurate and current across all platforms.
Google Review Signals and Engagement
Google reviews don’t just affect overall rankings – they can impact performance in specific geographic areas significantly. Reviews from customers in particular neighborhoods can boost visibility in those exact zones.
Review timing and frequency also matter considerably. A sudden influx of reviews can temporarily boost heat map performance, while lack of recent reviews might cause gradual decline in competitive areas.
Review engagement proves equally important. Responding to reviews, especially negative ones, demonstrates to Google that you actively manage your online reputation. This engagement can positively impact heat map performance across all tracked areas.
Local SEO Heat Map Strategy: Step-by-Step Blueprint
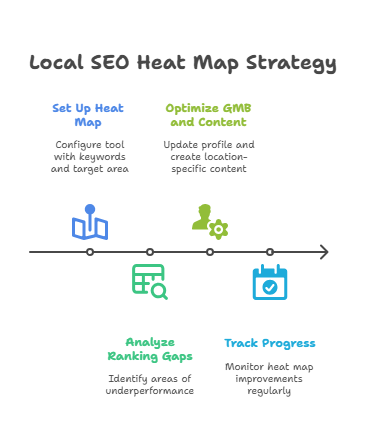
Step 1: Set Up a Heat Map by Keyword and Location
Begin by selecting your most important keywords – those that drive the most valuable traffic to your business. Avoid trying to track everything simultaneously; focus on 3-5 core keywords representing your main services.
Define your target area next. This should represent the geographic region where you realistically want to attract customers. For most local businesses, this spans a 5-20 mile radius from your location, but varies based on industry and business model.
Configure your heat map tool with a grid providing good coverage of your target area. More grid points deliver more detailed data but also cost more. Start with moderate grid size and increase if you need more granular information.
Set up your tool to track both mobile and desktop results when possible. Also configure competitor tracking for main competitors – this competitive intelligence proves invaluable for understanding market position.
Step 2: Analyze Ranking Gaps by Zone
Once your heat map generates data, invest time analyzing the patterns carefully. Look for areas where you consistently underperform and work to understand the underlying reasons.
Common reasons for ranking gaps include:
- Local Competition: Strong competitors dominating specific areas
- Citation Gaps: Lack of local citations or reviews from particular zones
- Content Gaps: Missing location-specific content on your website
- Technical Issues: Problems affecting certain geographic areas specifically
Prioritize gaps representing the biggest opportunities. Sometimes small gaps in high-value areas deserve more attention than large gaps in low-value areas. Document findings and create a prioritized action plan for tracking progress over time.
Step 3: Optimize Your GMB and On-Site Content
Based on gap analysis, create a targeted optimization plan. Start with your Google Business Profile, as this often produces the most immediate impact on local rankings.
Update your GMB profile with location-specific content. Add posts mentioning areas where you’re underperforming, upload photos taken in those areas, and encourage customers from those zones to leave reviews.
For your website, create location-specific content targeting weak areas. This might include dedicated service pages, blog posts about serving specific neighborhoods, or resource pages mentioning local landmarks and areas naturally.
Ensure your website’s technical SEO remains solid. Local businesses often have technical issues disproportionately affecting certain geographic areas. Check site speed, mobile responsiveness, and local schema markup implementation.
Step 4: Track Progress Weekly or Monthly
Establish a regular monitoring schedule to track heat map improvements consistently. Weekly monitoring works ideally for active campaigns, while monthly monitoring suffices for ongoing maintenance.
Focus on trends rather than daily fluctuations. Local rankings can be volatile, so concentrate on longer-term patterns rather than immediate changes that might be temporary.
Document progress with before-and-after heat map screenshots. This documentation proves valuable for understanding which strategies work best for your business and for reporting to stakeholders or clients.
Adjust strategy based on results. If certain tactics aren’t producing results after reasonable testing periods, pivot to different approaches. Heat maps provide clear feedback on what’s working and what needs adjustment.
Expert Tips to Get the Most Out of Your Heat Map Tool
Use GPS Coordinates for Precision
Most heat map tools allow input of specific GPS coordinates rather than just addresses. This precision can significantly impact results, especially in dense urban areas where a few blocks can mean the difference between ranking first and not ranking at all.
Use GPS coordinates to target specific high-value locations like shopping centers, business districts, or popular landmarks. If you know your ideal customers frequently search from specific locations, ensure your heat map includes those exact coordinates for accurate tracking.
This precision proves particularly valuable for businesses near geographic boundaries. If you’re close to city borders, county lines, or other boundaries, precise GPS targeting helps you understand how these boundaries affect your rankings and visibility.
Track Competitors on the Same Map
Most advanced heat map tools allow overlaying competitor data on your own heat map. This competitive intelligence proves incredibly valuable for understanding market position and identifying opportunities.
Look for areas where competitors are strong but you’re weak – these represent clear opportunities for improvement through targeted optimization. Conversely, areas where you’re strong but competitors are weak might be worth defending with additional optimization efforts.
Pay attention to competitor patterns that might reveal their optimization strategies. If a competitor consistently performs well in certain areas, investigate why. Are they targeting specific keywords you’re missing? Do they have strong local partnerships in those areas?
Schedule Reports to Monitor Long-Term Growth
Set up automated reports tracking heat map performance over time. Monthly reports usually suffice for most businesses, but weekly reports can prove valuable during active optimization campaigns.
These automated reports should include:
- Performance Summaries: Overall ranking performance across all tracked areas
- Change Alerts: Significant ranking changes by specific areas
- Competitor Comparisons: How your performance compares to tracked competitors
- Improvement Recommendations: Suggested next steps based on current data
Use these reports to identify long-term trends and seasonal patterns. Some businesses experience predictable seasonal changes in heat map performance, and understanding these patterns helps plan optimization efforts more effectively.
Local SEO Heat Map FAQs
How Often Should You Update Heat Maps?
Heat map update frequency depends on your business type and competitive landscape. For most local businesses, weekly updates provide an optimal balance of current data and cost-effectiveness.
However, businesses in highly competitive markets might benefit from daily updates, especially during active optimization campaigns. Conversely, businesses in stable markets with limited competition might find monthly updates sufficient for their needs.
Consider updating more frequently during:
- Active Campaigns: When running intensive local SEO campaigns
- Algorithm Updates: After major Google algorithm updates that might affect local rankings
- Peak Seasons: During seasonal peak periods for your specific business
- Competitive Monitoring: When monitoring competitor activities or new market entrants
Remember that local rankings can be volatile, so focus on trends rather than daily fluctuations when interpreting heat map data for strategic decisions.
Can Heat Maps Help with Voice Search Rankings?
Yes, heat maps can be valuable for voice search optimization, though the relationship isn’t always direct. Voice searches often carry strong local intent, and many voice search results are drawn from the same local pack results that heat maps track.
Voice search queries tend to be more conversational and location-specific than traditional text searches. If your heat map shows strong performance for natural language keywords in specific areas, you’re likely also performing well for related voice searches from those locations.
To optimize for voice search using heat map data:
- Focus on Conversational Keywords: Target natural language keywords showing strong heat map performance
- Answer Common Questions: Create content answering common voice search questions about your local area
- Optimize GMB Completely: Ensure Google Business Profile is fully optimized, as voice assistants often pull information from GMB listings
What’s the Best Radius to Track in Cities vs. Rural Areas?
Optimal tracking radius varies significantly between urban and rural environments. In dense urban areas, you might only need to track a 5-10 mile radius due to high competition and concentrated market nature.
Rural businesses often need to track much larger areas – sometimes 20-50 miles or more – because customers willingly travel farther for services and there’s less local competition affecting rankings.
Consider these factors when determining tracking radius:
- Customer Travel Distance: How far customers typically travel to reach your business
- Competition Density: The concentration of competitors in your area
- Service Capacity: Your marketing budget and capacity to serve a larger area effectively
- Infrastructure: Transportation infrastructure and accessibility factors
Start with a conservative radius and expand if you’re seeing opportunities at the edges of your current tracking area. It’s better to dominate a smaller area completely than spread efforts too thin across a large region.
Conclusion: Heat Maps Are Local SEO Superpower Tools
Why Every Local Business Should Be Using Them in 2025
We’re living in an era where local search dominates consumer behavior. Over 80% of consumers use search engines to find local information, and these searches lead to purchases within 24 hours more often than any other search type.
Yet most local businesses operate blind regarding their search visibility. They assume they rank well everywhere because they rank well when searching from their own location. Heat maps shatter this dangerous illusion and reveal the truth about local market presence.
Businesses embracing heat map technology in 2025 gain significant competitive advantages. They know exactly where they’re strong and where they’re weak. They make data-driven decisions about marketing focus areas. Most importantly, they stop leaving money on the table in areas where they’re invisible to potential customers.
Heat maps also level the playing field for smaller businesses. You don’t need massive marketing budgets to use this technology effectively. Small businesses using heat maps strategically often outperform larger competitors still using outdated, generic local SEO approaches.
Next Steps: Try a Free Heat Map Tool Today
The best way to understand heat map power is seeing your own business data visualized. Most tools mentioned in this guide offer free trials or freemium versions letting you generate your first heat map without upfront investment.
Start with these simple steps:
- Choose a Tool: Select one of the heat map tools mentioned in this guide
- Set Up Tracking: Configure tracking for your top 2-3 most important keywords
- Generate Your First Map: Create your initial heat map and study the results carefully
- Identify Opportunities: Find your biggest opportunity areas for improvement
- Create Action Plan: Develop a simple optimization plan focusing on weakest zones
Don’t attempt to fix everything simultaneously. Pick one or two clear opportunities and focus there first. Heat map optimization is a marathon, not a sprint, and consistent effort over time delivers the best sustainable results.
Remember, every red zone on your heat map represents potential customers who can’t find you when they search. Every optimization you make based on heat map data is an investment in expanding market reach and growing your business systematically.
