
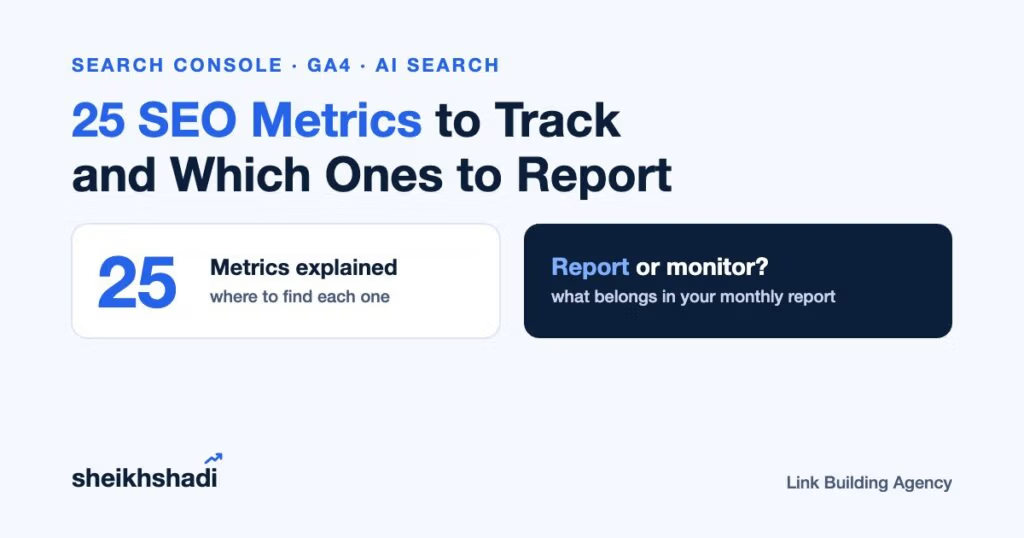
SEO metrics are the numbers that show how your site performs in search. They tell you whether people see it, whether they click and whether the visit turns into a lead or a sale. There are about 25 worth understanding, but only about half deserve a place in the report your boss or client reads.
The rest are diagnostics. You check them when a reported number moves and you need to know why. I’ve worked in SEO since 2012. The rule I keep coming back to is simple: report outcomes, monitor causes.
Below, each metric gets a plain explanation, where to find it and what it can (and can’t) tell you. The table below gives you all 25 at a glance first. The reporting shortlist comes at the end.
What is the difference between an SEO metric and an SEO KPI?
A metric is any number you can measure, such as organic clicks. A KPI is a metric you’ve tied to a business goal and a target. “Organic clicks” is a metric. “Grow non-branded organic clicks to 4,000 a month by June” is a KPI.
If you can only pick three KPIs, pick non-branded organic clicks, organic conversions and the revenue or pipeline those conversions create. That trio covers reach, action and money. Everything else on this page either feeds those three or explains why they moved.
Which KPIs fit your type of business?
The right three KPIs depend on what you sell. Start from the row closest to your business:
| Business type | Top 3 SEO KPIs |
|---|---|
| B2B SaaS | Non-branded clicks, demo or trial signups from organic, organic pipeline |
| Ecommerce | Non-branded clicks to product and category pages, organic revenue, organic conversion rate |
| Local service business | Calls and form leads from organic, clicks to service pages, Google Business Profile actions |
| Publisher or blog | Organic sessions, engagement rate, newsletter signups (or ad revenue per visit) |
Each set mixes one reach number with the actions that actually pay the bills. Swap in your own goal if none of the rows fits.
For a deeper look at setting targets for each one, see our guide to SEO KPIs and how to read them.
What are the key SEO metrics? 25 numbers at a glance
The table lists all 25 metrics in the order this guide explains them: where to find each one, what good looks like and whether it belongs in your report or on your monitoring sheet. “Own baseline” means no suitable external benchmark is used here, so compare against the same period last year.
| # | Metric | Where to find it | What good looks like | Report or monitor |
|---|---|---|---|---|
| 1 | Impressions | Search Console, Performance | Up year over year on your target topics | Report |
| 2 | Clicks | Search Console, Performance | Up year over year | Report |
| 3 | Click-through rate (CTR) | Search Console (clicks ÷ impressions) | 1% to 2% for a whole site; compare with your DR band | Report |
| 4 | Average position | Search Console, Performance | Trend per query or page, not site-wide | Monitor |
| 5 | Ranking queries and pages | Search Console, Queries and Pages tabs | More queries and pages with impressions each quarter | Monitor |
| 6 | Branded vs non-branded clicks | Search Console, branded queries filter | Own baseline; non-branded growing faster | Report |
| 7 | AI Overview and AI Mode visibility | Search Console, Generative AI performance | Own baseline; more pages earning AI impressions | Report |
| 8 | AI referral sessions | GA4, Traffic acquisition by session source | Own baseline; check what those visits convert | Report |
| 9 | Tracked keyword rankings | Ahrefs or Semrush rank tracker | More target keywords in the top 3 and top 10 | Report |
| 10 | Share of voice | Rank tracker visibility score | Rising against the competitors you track | Report |
| 11 | SERP features won | Rank tracker, SERP features view | More snippets, videos or images that link to you | Monitor |
| 12 | Organic sessions | GA4, Traffic acquisition, Organic Search | Trend moves with Search Console clicks | Report |
| 13 | Organic landing pages | GA4, Landing page report | Your key pages among the top entries | Monitor |
| 14 | Engagement rate | GA4 | Own baseline by page type | Report |
| 15 | Bounce rate | GA4 (add it to a report) | 100% minus engagement rate | Monitor |
| 16 | Average engagement time | GA4, Engagement overview | Own baseline per page type | Monitor |
| 17 | Views per session | GA4 | Higher on hubs and stores; one view is fine for a single-answer page | Monitor |
| 18 | Organic conversions (key events) | GA4 key events, Organic Search | Own baseline, tied to your goal | Report |
| 19 | Organic conversion rate | GA4, session key event rate | Own baseline by page type | Report |
| 20 | Organic revenue or pipeline | GA4 ecommerce, or your CRM | Rising quarter over quarter | Report |
| 21 | SEO ROI | (Value from SEO − cost) ÷ cost | Positive and rising; check quarterly | Report |
| 22 | Referring domains | Ahrefs or Semrush | Steady growth from relevant sites | Report |
| 23 | Authority scores (DR, DA, AS) | Ahrefs, Moz or Semrush | A tool estimate; watch the trend | Monitor |
| 24 | Indexed pages | Search Console, Page indexing | Every page you want found is indexed | Monitor |
| 25 | Core Web Vitals | Search Console, Core Web Vitals | LCP ≤ 2.5 s, INP ≤ 200 ms, CLS ≤ 0.1 | Monitor |
How to judge an outside benchmark
Benchmarks you find online often come without a method. Before you compare your site with one, check four things:
- Who measured it. A named company or researcher, not “industry data”.
- How many sites it covers. Data from thousands of sites tells you more than a handful of clients.
- When it was measured. Search changes fast, so prefer data from the last 12 months.
- Whether those sites look like yours. A study of large brands won’t fit a new site.
If you can’t answer all four, use your own numbers from the same period last year instead. That’s why only CTR and Core Web Vitals carry an outside benchmark in the table above.
Each number is explained in its own section below, grouped by where the data comes from.
Search Console metrics: how people find you
Google Search Console is the first place to look because it is Google’s own data about your site. Everything in this group lives in the Performance report.
1. Impressions
An impression is counted when a link to your site appears on a results page someone loads. The searcher doesn’t have to scroll to it for the impression to count on a normal results page. Rising impressions mean Google is showing you for more searches or more often. Falling impressions are usually the first warning sign of a ranking drop.
2. Clicks
Clicks are the visits Google sends to your site from search results. This is the closest thing to “SEO traffic” you can get from Google itself. Clicking the same result twice in one search counts once.
3. Click-through rate (CTR)
CTR is clicks divided by impressions. A page with 200 clicks from 10,000 impressions has a 2% CTR.
For a whole site, a good CTR usually sits between 1% and 2%, based on Ahrefs’ 2026 study of Search Console data from more than 400,000 sites. The study also found different median whole-site CTRs across Domain Rating bands, so compare yours with its band:
| Ahrefs DR band | Median whole-site CTR |
|---|---|
| 0 to 10 | 0.39% |
| 30 to 40 | 0.65% |
| 50 to 60 | 0.84% |
| 70 to 80 | 1.25% |
| 80 to 90 | 2.27% |
So a DR 35 site at 0.7% isn’t failing. It sits just above the median for its band. A low CTR on a page that ranks well usually points to a weak title, a weak description or a search where Google answers the question on the results page.
4. Average position
Average position is easy to misread. Google records the topmost position your site held for each query, then averages it across queries. If one query shows you at positions 2, 4 and 6, it counts as 2. If another shows you at 3, 5 and 9, it counts as 3. Your average position is 2.5.
That’s why the number can jump when you start appearing for new long-tail searches at position 40. Nothing got worse; the mix changed. It also explains why your own search shows a different spot. Location, device and history all change what each person sees. Use average position to spot trends on one page or one query, not as a site-wide score.
5. Ranking queries and pages
Count how many queries and how many pages earn at least one impression in a period. Growth here means Google trusts more of your content for more topics. It’s a good early signal for a new site, long before clicks pick up. If you’re unsure what a query is versus a keyword, our explainer on search queries covers the difference.
6. Branded vs non-branded clicks
Branded clicks come from people who already know you. Non-branded clicks come from people who found you because of your content. The second number shows whether SEO is creating new demand.
Search Console now has a built-in branded queries filter that splits the two for you. It isn’t available on sites with very low impressions. Google’s help page for the filter explains another quirk: Google hides some rare queries for privacy. Those anonymized queries are included in the chart totals, but they drop out as soon as you apply a query filter. That’s why branded plus non-branded clicks often won’t add up to your total.
AI search metrics: Overviews, AI Mode and chat referrals
AI answers now sit on top of many results pages. Two numbers tell you how your site is doing there.
7. AI Overview and AI Mode visibility
Search Console has a Generative AI performance report, rolled out to all websites on 31 August 2026. It shows how often links to your site appeared in AI Overviews and AI Mode, by page, country, device and date. It reports impressions only, so you can’t read clicks or CTR from it.
The same data also sits inside the normal Performance report under the Web search type, mixed with your other results. Google’s position help page explains the counting: an AI Overview takes up a single position. A click on a link inside it counts as a normal click.
For your most important queries, check by hand which ones trigger an AI Overview and whether you’re cited. AI tracking tools such as Ahrefs Brand Radar or Semrush’s AI toolkit can estimate how often your brand appears across AI answers at scale.
8. AI referral sessions
When someone clicks a link in ChatGPT, Perplexity, Gemini or Copilot, the visit can show up in GA4 as a referral from that tool’s domain, such as chatgpt.com. Filter the Traffic acquisition report by session source to see them. Some of these clicks arrive without referrer data and land in Direct, so treat the figure as a minimum.
Rank tracking metrics: where you stand on the keywords you chose
Search Console shows the queries Google chose for you. A rank tracker shows the keywords you chose, checked the same way every day.
9. Tracked keyword rankings
A rank tracker checks a fixed list of keywords from one location and device. That makes it more stable than average position, though it only covers the list you gave it. The most useful view is how many keywords sit in the top 3 and the top 10. Then watch how that count changes month to month.
10. Share of voice
Share of voice (some tools call it visibility) estimates what share of all clicks for your tracked keywords lands on your site. Each tool calculates it its own way. Compare it against competitors inside one tool, but don’t compare one tool’s figure with another’s.
11. SERP features won
These are the extras on a results page that link to you: featured snippets, video results, image packs and similar. Winning one can lift clicks without a ranking change. Our guide to what a SERP is walks through the common features.
GA4 metrics: what visitors do after the click
Google Analytics 4 picks up where Search Console stops. Filter every report in this group to the Organic Search channel.
12. Organic sessions
Sessions are visits that started from organic search. You’ll find them under Traffic acquisition. Don’t expect them to match Search Console clicks. GA4 depends on cookie consent and the tracking tag loading, while Search Console counts clicks on Google’s side.
13. Organic landing pages
This shows which pages people land on from search. It tells you which content is doing the work and which pages lost traffic after an update. Sort by sessions, then compare with the same month last year.
14. Engagement rate
GA4 counts a session as engaged if it lasts longer than 10 seconds, includes a key event or has at least two page views. Engagement rate is the share of sessions that meet one of those tests. It is a better quality signal than raw traffic because it filters out people who landed and left at once.
15. Bounce rate
Bounce rate changed meaning when GA4 replaced Universal Analytics. In GA4 it is simply the share of sessions that weren’t engaged. Google’s help page puts it plainly: “The bounce rate is the opposite of the engagement rate.” That means old benchmarks built on the Universal Analytics definition don’t carry over. Watch the trend for your own pages instead.
16. Average engagement time
This is how long your page was in focus on the visitor’s screen. It replaced the old average session duration. “Dwell time” often shows up in SEO advice, but it isn’t a metric GA4 or Search Console reports. Engagement time is the closest thing you can measure.
17. Views per session
This is the average number of pages viewed in one visit. It’s useful for content hubs and stores where you want people to move on to a second page. For a single-answer page, one view can be a perfectly good outcome.
Business metrics: what search is worth
These are the numbers your boss or client cares about most. They need GA4 key events or a CRM to be set up properly first.
18. Organic conversions (key events)
GA4 now calls the actions you care about “key events”: a form fill, a demo request, a purchase or a signup. “Conversion” is reserved for the Google Ads side. Mark your most important actions as key events, then count how many came from organic sessions.
19. Organic conversion rate
Conversion rate is the share of organic sessions that include at least one key event. GA4 shows it as session key event rate. For example, if 60 of 4,000 organic sessions include a demo request, your conversion rate is 1.5%. Track it per landing page. A page with lots of traffic and few conversions needs a better offer or a clearer next step, not more traffic.
20. Organic revenue or pipeline
Ecommerce sites can read organic revenue straight from GA4 once purchase tracking works. For B2B, the useful number lives in your CRM: the pipeline value of deals whose first or last touch was organic search. Agree on one attribution rule with your sales team and keep it stable, or the trend will mean nothing.
21. SEO ROI
ROI is (value from SEO minus cost of SEO) divided by cost of SEO. Here’s a worked example with stated inputs. If SEO costs $4,000 a month and organic deals bring in $10,000 of gross profit that month, ROI is ($10,000 − $4,000) ÷ $4,000, which is 150%. Use gross profit, not revenue. Count content, tools and staff time in the cost too. SEO compounds slowly, so judge ROI over 6 to 12 months rather than one.
Authority and technical health metrics
Referring domains belong in the report, since they show whether other sites keep citing you. The other three mostly stay on your monitoring sheet, but they explain a lot when rankings move.
22. Referring domains
This is the number of unique websites linking to yours, shown in Ahrefs or Semrush. One link each from 50 relevant sites usually matters more than 500 links from one site. Watch for sudden spikes or drops. If the profile looks odd, a backlink audit shows what changed.
23. Authority scores (DR, DA and Authority Score)
Domain Rating (Ahrefs), Domain Authority (Moz) and Authority Score (Semrush) are third-party estimates of a site’s link strength. None of them is a Google metric. They’re handy for comparing sites inside one tool. They also answer a common question: there’s no official “SEO score” from Google. Any score you see comes from the tool that made it. Our domain authority guide explains how these scores are built.
24. Indexed pages and indexing errors
The Page indexing report in Search Console shows how many of your URLs are in Google’s index and why others aren’t. A sudden drop in indexed pages, or a jump in “Crawled, currently not indexed”, deserves a look before it shows up as lost traffic.
25. Core Web Vitals
Core Web Vitals measure loading, responsiveness and visual stability with real-user data. Google’s recommended thresholds are Largest Contentful Paint within 2.5 seconds, Interaction to Next Paint of 200 milliseconds or less and Cumulative Layout Shift of 0.1 or less. INP replaced First Input Delay on 12 March 2024. If a tool still reports FID, it’s out of date. Google judges each threshold at the 75th percentile of page loads.
Which SEO metrics should you report?
Here’s the short list. These are the metrics marked “Report” in the table. They go in your monthly report:
- Visibility: impressions, clicks, CTR, branded vs non-branded clicks, tracked keyword rankings, share of voice
- AI search: AI Overview and AI Mode visibility, AI referral sessions
- Traffic: organic sessions, engagement rate
- Business: organic conversions, conversion rate, revenue or pipeline, SEO ROI
- Authority: referring domains
Why these? Each one answers a question your boss actually asks. Are more people finding us? Are they clicking? Are they turning into leads? Is it worth the money?
What about the rest? Average position, bounce rate, authority scores, Core Web Vitals and the others are your diagnostic tools. You check them when a reported number drops. Nobody needs to see them every month.
Your CEO doesn’t need the whole list either. Give them four numbers: non-branded clicks, conversions, revenue (or pipeline) and ROI. If those four go up, SEO is working. If they don’t, the rest of the list tells you why.
How do you measure SEO success?
Measure it against a baseline, not against a feeling. Here’s the routine I’d set up for any site:
- Record a baseline. Save the last 12 months of your reported metrics before any new work starts.
- Pick three to five KPIs with targets. Tie each to a business goal and a date.
- Compare like with like. Put each month next to the same month last year so seasonality doesn’t fool you.
- Log every change. Note site releases, content launches and Google updates on the date they happened. Then check the Manual actions report, your content and your technical health before deciding what caused a drop. Matching dates alone don’t prove a cause.
SEO success means the KPIs moved in the right direction for long enough to rule out noise. One good month isn’t success. A rising trend over two or three quarters is.
What is the 80/20 rule for SEO?
It’s the Pareto idea that a small share of your pages brings most of your clicks. To find yours, open Search Console’s Performance report, switch to the Pages tab and sort by clicks. Then count how few URLs make up most of the total.
The split won’t always be exactly 80/20, so rank those pages by business value as well as clicks. The ones that drive leads or sales are usually the best place to start with content refreshes and internal links, alongside any new content you plan. Their clicks then become a KPI in their own right.
My take: report fewer numbers and explain every one
A report with 40 charts protects the person who wrote it, not the person reading it. If you run SEO in-house or for clients, send the reported metrics with one sentence each on what changed and why. If you own a small business and do your own SEO, start with clicks, non-branded clicks and conversions. Add the rest once those three are tracked properly.
Skip the vanity numbers. A higher authority score or a better average position is nice to see. It means little if conversions and pipeline stay flat.
Not sure which numbers on your dashboard are moving the business? Ask us for a free SEO audit and we’ll point out the ones worth putting in your next report.