
Picture this scenario: You believe your business dominates local search results, but then you discover customers just two miles away cannot find you on Google. Frustrating, right?
This is exactly why savvy business owners are embracing local SEO heatmaps. These visual tools reveal precisely where your business ranks across your entire service area, not just from your office computer.
In this comprehensive guide, you will learn everything about 5×5 local SEO heatmaps, how they function, and most importantly, how to leverage them to dominate your local competition. Let us dive in.
What Is a Heatmap Local SEO 5×5 Grid?
A 5×5 local SEO heatmap is a visual map displaying how your business ranks for specific keywords across 25 different points in your service area. Think of it as a bird’s-eye view of your local search performance.
Instead of guessing your ranking position, you receive a colorful grid showing your exact position at each location. Green indicates you are winning, yellow means you are performing adequately, and red signals you need improvement.
Why It Matters
Most business owners do not realize that Google rankings change based on search location. A customer in the north part of town might see completely different results than someone searching from the south.
This geographic variation occurs because Google uses proximity as a major ranking factor. The closer someone is to your business, the more likely you appear in their search results.
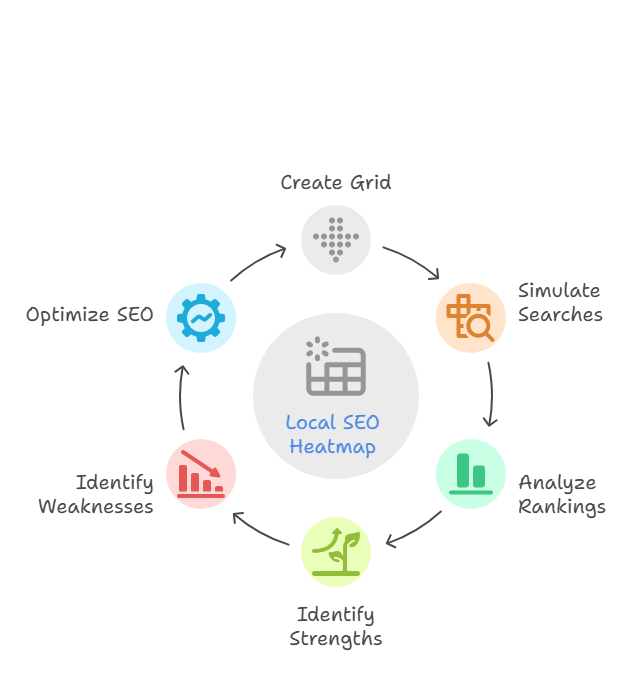
A heatmap helps visualize keyword ranking strength and weakness across your geographic target area, enabling smarter SEO decisions. Instead of operating blindly, you gain data-driven insights that truly matter.
How Does a 5×5 Grid Work?
How Grid Points Are Determined
Each point represents a GPS coordinate spaced equally around your location. The tool creates a perfect grid with your business typically at the center, then checks rankings from each of those 25 points.
Here is the breakdown:
- Center point: Your business location
- Surrounding points: 24 evenly spaced locations around you
- Distance coverage: Typically covers a 3-5 mile radius (customizable)
- Search simulation: The tool performs actual Google searches from each point
Ranking is measured using search proximity, meaning the tool simulates what real customers would see when searching from different locations in your area.
Example Visualization
Imagine you operate a coffee shop downtown. Your 5×5 heatmap might display:
- Green zones: Areas where you rank positions 1-3 (usually close to your shop)
- Yellow zones: Areas where you rank positions 4-6 (competitive but manageable)
- Red zones: Areas where you rank position 7 or lower, or do not appear at all
This visual instantly reveals where your SEO efforts are working and where they fall short. No more guessing games.
Benefits of Using a Local SEO Heatmap
Geo-Based Ranking Visibility
Get a true picture of where your Google Business Profile ranks, not just one average position. Most rank tracking tools provide a single number, but that does not tell the complete story.
With a heatmap, you might discover you rank first in the west part of town but remain completely invisible in the east. That is actionable intelligence unavailable elsewhere.
This geographic insight helps you understand your true market reach and identify expansion opportunities you never knew existed.
Spot Gaps and Opportunities
Quickly identify where competitors outrank you and where you dominate. The visual nature of heatmaps makes patterns immediately apparent.
For example, you might notice:
- Weak spots near competitor locations
- Strong performance in unexpected areas
- Opportunities in underserved neighborhoods
- Patterns correlating with your marketing efforts
These insights help you allocate your marketing budget more effectively and focus on areas with the biggest potential impact.
Track Progress Over Time
Compare maps monthly to monitor your SEO effort impact. This is where heatmaps truly excel, turning abstract SEO work into concrete visual progress.
You can literally watch your green zones expand as your optimization efforts pay off. It is incredibly motivating to see your hard work translated into geographic market share.
Additionally, if something goes wrong (like a competitor launching an aggressive campaign), you will spot it immediately rather than wondering why your phone stopped ringing.
5×5 vs 7×7 vs 9×9: Which Grid Is Best?
When to Use a 5×5 Grid
A 5×5 grid is ideal for hyperlocal businesses like coffee shops, dentists, salons, or restaurants covering smaller areas. If most customers come from within a 3-5 mile radius, this grid size provides perfect insight without overwhelming detail.
Benefits of 5×5 grids:
- Faster scanning (less data to process)
- Lower cost (fewer data points)
- Easier to analyze and act upon
- Perfect for brick-and-mortar businesses
When to Use a 7×7 or 9×9 Grid
Larger grids work better for businesses with broader service areas like realtors, roofers, plumbers, or home service professionals who travel to customers.
If you regularly serve customers 10+ miles away, a 7×7 (49 points) or 9×9 (81 points) grid provides the broader perspective you need.
Consider larger grids if:
- You operate a mobile service business
- Your service area spans multiple cities
- You are in a rural area with spread-out customers
- You want extremely detailed competitive intelligence
Pros and Cons Comparison
5×5 Grid:
- Pros: Faster scans, laser-focused insights, budget-friendly
- Cons: Limited geographic scope, might miss broader opportunities
7×7 Grid:
- Pros: More comprehensive data, better for medium-sized service areas
- Cons: Slightly longer scan time, more expensive
9×9 Grid:
- Pros: Macro view, best for large or regional coverage, maximum detail
- Cons: Slower scans, highest cost, can overwhelm small businesses
How to Use a Local SEO Heatmap to Boost Rankings
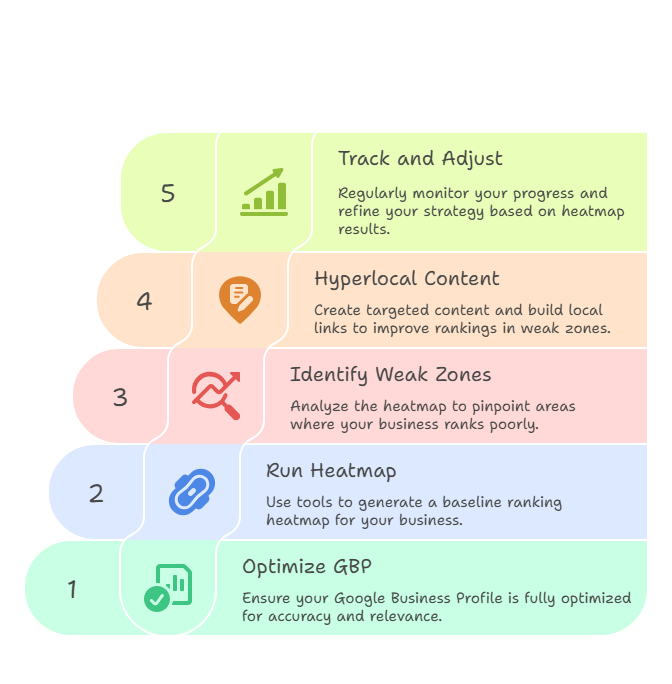
Step 1: Connect Google Business Profile
Before running your first heatmap, ensure your Google Business Profile is fully optimized. This is your foundation, everything else builds upon it.
Your GBP optimization checklist:
- Complete NAP data: Name, address, phone number must be consistent
- Primary category: Choose the most accurate business category
- Secondary categories: Add relevant additional categories
- Business description: Include your target keywords naturally
- Hours of operation: Keep them current and accurate
- Photos: Add high-quality images regularly
- Reviews: Encourage and respond to customer reviews
Remember, your heatmap is only as effective as your underlying business profile. Fix the basics first, then use the heatmap to fine-tune your strategy.
Step 2: Run Your First Heatmap
Use a tool like Local Falcon or BrightLocal to generate your starting point rankings. This baseline measurement is crucial for tracking future progress.
When setting up your first scan:
- Choose your most important keyword (like “dentist near me”)
- Set your business location as the center point
- Select appropriate grid size (5×5 for most local businesses)
- Choose your target radius (typically 3-5 miles)
- Run the scan and save the results
Pro tip: Take a screenshot of your first heatmap. You will want to compare it to future results to visualize your progress.
Step 3: Identify Low-Ranking Zones
Look for yellow or red zones where your business ranks position 4 or lower. These represent your biggest opportunities for improvement.
Pay special attention to:
- Patterns: Are all your weak spots in one direction?
- Competitor proximity: Do weak zones correlate with competitor locations?
- Geographic barriers: Are rivers, highways, or other features affecting rankings?
- Population density: Are weak zones in high-traffic areas?
Document these weak zones and prioritize them based on potential customer value. A red zone in a busy shopping district matters more than one in an industrial area.
Step 4: Hyperlocal Content and Link Building
Create content focused on those weak zones and earn backlinks from nearby local directories or blogs. This is where the real transformation happens.
Hyperlocal content strategies:
- Neighborhood guides: “Best Coffee Shops in [Neighborhood Name]”
- Local event coverage: Sponsor or cover community events
- Area-specific services: “Plumbing Services in [Specific Area]”
- Local partnerships: Collaborate with nearby complementary businesses
Link building for weak zones:
- Local chamber of commerce websites
- Neighborhood association directories
- Local news websites and blogs
- Community event websites
- Local business directories specific to those areas
Step 5: Track, Adjust and Repeat
Rerun heatmaps monthly to test improvements and adjust your strategy. Consistency is key, local SEO is a marathon, not a sprint.
Your monthly routine should include:
- Run new heatmap with same settings
- Compare to previous month’s results
- Document improvements and setbacks
- Identify new opportunities
- Adjust content and link building strategy
- Plan next month’s optimization efforts
Keep a simple spreadsheet tracking your average ranking position across all grid points. This gives you a single number to measure progress while maintaining detailed geographic insights.
Top Tools to Generate Heatmaps
Choosing the right heatmap tool can make or break your local SEO efforts. Here are the top three options, each with unique strengths:
Local Falcon – Most Popular and Robust Tool
Why it excels: Local Falcon pioneered the local SEO heatmap concept and remains the gold standard. Their interface is intuitive, data is accurate, and they offer the most comprehensive feature set.
Key features:
- Multiple grid sizes (3×3 up to 9×9)
- Historical data tracking
- Competitor comparison
- Mobile vs desktop rankings
- Automated monthly reports
- API integration
Best for: Agencies and businesses serious about local SEO who want the most detailed insights.
BrightLocal’s Local Search Grid – Great UI and Reporting
Why it excels: BrightLocal integrates heatmaps into their broader local SEO platform, making it easy to connect ranking data with other metrics like reviews and citations.
Key features:
- Beautiful, easy-to-understand interface
- Integrated with full local SEO toolkit
- White-label reporting for agencies
- Automated competitor tracking
- Custom grid positioning
Best for: Businesses already using BrightLocal’s other tools or those who prioritize clean, professional reporting.
GeoGrid by Whitespark – Solid Option with Flexible Pricing
Why it excels: Whitespark offers a more budget-friendly option without sacrificing essential features. Their tool is straightforward and gets the job done without overwhelming complexity.
Key features:
- Simple, no-frills interface
- Competitive pricing
- Essential heatmap functionality
- Good customer support
- Pay-per-scan option available
Best for: Small businesses or those just getting started with local SEO heatmaps who want to test the waters.
Tool Integrations and Automation Tips
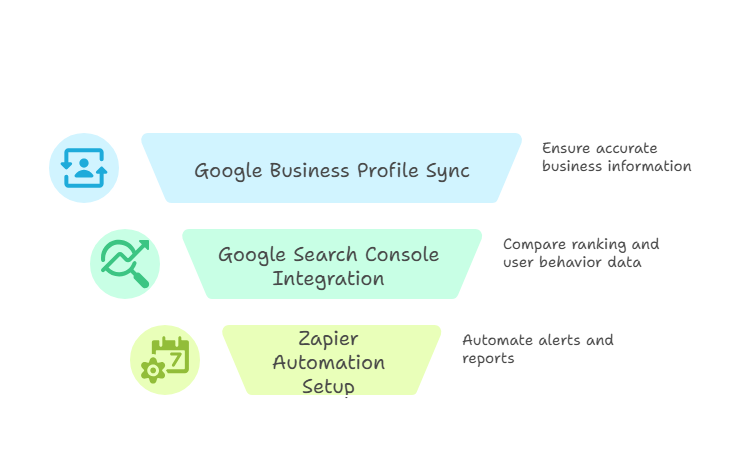
Using with Google Business Profile
Sync directly to pull in and optimize business data. Most modern heatmap tools can connect to your Google Business Profile to automatically pull in your business information, categories, and even some performance data.
This integration helps you:
- Ensure accurate business location data
- Track ranking changes after GBP updates
- Correlate ranking improvements with profile optimization
- Monitor the impact of new photos, posts, and reviews
Pro tip: Set up alerts for when your GBP information changes. Sometimes Google automatically updates your profile, and you want to know immediately if it affects your rankings.
Integration with Google Search Console
Compare click data with heatmap positions for deeper insights. This combination gives you both ranking data and actual user behavior data.
What to look for:
- Ranking vs clicks: High rankings but low clicks might indicate poor snippet optimization
- Geographic patterns: Do high-ranking areas correlate with high click-through rates?
- Seasonal trends: How do rankings and clicks change throughout the year?
- Keyword performance: Which keywords drive the most traffic from high-ranking zones?
Zapier Automation (Time-saver)
Trigger Slack alerts, automated monthly scans, or spreadsheet logging. Automation transforms heatmap data from a monthly chore into a seamless part of your business intelligence system.
Popular automations:
- Slack notifications: Get alerts when rankings drop significantly
- Automated reports: Monthly heatmap summaries sent to your email
- Spreadsheet logging: Automatically track ranking changes over time
- CRM integration: Connect ranking data with lead and sales data
- Social media alerts: Share ranking improvements with your team
The key is setting up automations that actually save time rather than creating more work. Start simple with one or two automations, then expand as you see their value.
Mobile Rankings and User Behavior Differences
Why Mobile Rankings Matter
Over 60% of local searches happen on mobile devices, and that number continues growing. More importantly, mobile searchers have different intent and behavior patterns than desktop users.
Mobile users are typically:
- Location-focused: They want businesses nearby, right now
- Action-oriented: They are ready to call, visit, or buy
- Time-sensitive: They need quick answers and immediate solutions
- Proximity-driven: They are often already out and about, looking for nearby options
Google uses local pack results based on GPS proximity, which means mobile rankings can vary dramatically from desktop rankings. A business might rank first on desktop but eighth on mobile from the same location.
How to Analyze Mobile vs Desktop Rankings
Use heatmap tools with mobile toggle to view mobile visibility and side-by-side comparison with desktop results. This dual view often reveals surprising insights.
Common patterns you might discover:
- Mobile penalties: Some businesses rank much lower on mobile due to site speed or usability issues
- Proximity boost: Mobile rankings may be more sensitive to exact location
- Feature differences: Mobile results include different elements (call buttons, directions, etc.)
- Competitor variations: Different competitors may dominate mobile vs desktop
Action steps for mobile optimization:
- Run separate heatmaps for mobile and desktop
- Identify significant discrepancies between the two
- Focus on mobile-specific ranking factors (site speed, mobile-friendliness)
- Optimize for mobile-specific features (click-to-call, directions)
- Monitor mobile rankings more frequently (they change faster)
Advanced Tips for Better Local Rankings with Heatmaps
Once you have mastered the basics, these advanced strategies can give you a significant competitive edge:
Link Internal Blog Content to Weak Heatmap Zones
Create a content strategy that specifically targets your red and yellow zones. Instead of writing generic blog posts, create content that serves people in your weak areas.
Advanced internal linking strategies:
- Geographic anchor text: Use location-specific anchor text when linking to service pages
- Content clusters: Build topic clusters around neighborhood-specific content
- Seasonal content: Create content that targets weak zones during peak seasons
- FAQ optimization: Answer common questions from people in weak zones
Set Up UTM Tracking with GBP to Measure Conversion Lift
Connect your heatmap improvements to actual business results. UTM tracking lets you see which geographic areas are driving the most valuable customers.
Implementation steps:
- Add UTM parameters to your Google Business Profile website link
- Track traffic and conversions by geographic area
- Correlate conversion data with heatmap performance
- Focus optimization efforts on high-converting weak zones
- Calculate ROI of your heatmap-driven SEO efforts
Use Photos with EXIF Geo-tags Linked to Low-Performing Zones
Upload photos taken in your weak zones with proper EXIF data. This helps Google understand your business connection to those areas.
Photo geo-tagging strategies:
- Service area photos: Take pictures of your work in weak zones
- Community involvement: Photos from local events in target areas
- Before/after shots: Show completed work in different neighborhoods
- Team photos: Pictures of your staff in various service areas
Add Service Keywords Plus Location in GBP Description and Posts
Optimize your Google Business Profile content to include specific neighborhoods and areas where you want to improve rankings.
Content optimization tactics:
- Description optimization: Naturally mention weak zone neighborhoods in your business description
- Regular posts: Create posts about work or activities in target areas
- Service area expansion: Add specific neighborhoods to your service area settings
- Review responses: Mention neighborhood names when responding to reviews
Frequently Asked Questions
How often should I run a 5×5 heatmap?
At least once per month or after major SEO changes. Monthly tracking gives you enough data to spot trends without overwhelming you with information.
However, you might want to run heatmaps more frequently if:
- You are in a highly competitive market
- You have made significant changes to your Google Business Profile
- You have launched a major marketing campaign
- You notice sudden changes in website traffic or phone calls
- A new competitor has entered your market
Does a higher grid size give better results?
Not always, higher grids show more data but take longer and cost more. Choose based on your business coverage area and budget.
Consider your business type:
- Hyperlocal businesses: 5×5 is usually perfect
- Medium service areas: 7×7 provides good detail without overwhelm
- Large service areas: 9×9 gives comprehensive coverage
- Enterprise/Multi-location: Multiple smaller grids often work better than one large grid
Can heatmaps show me my actual customers’ search experience?
Yes, they simulate results based on GPS locations to mimic real user proximity. This is much more accurate than traditional rank tracking that only checks from one location.
Heatmaps account for:
- Google’s proximity-based ranking algorithm
- Local pack variations by location
- Mobile vs desktop differences
- Real-time search result variations
What if my heatmap shows mostly red zones?
Do not panic! This is actually valuable information. It means you have huge opportunities for improvement and your competitors are not unbeatable.
Start with these steps:
- Focus on your Google Business Profile optimization first
- Pick just 2-3 zones to improve initially
- Create location-specific content for those areas
- Build citations and links in those neighborhoods
- Be patient, improvements take 30-90 days to show
How do I know if my heatmap improvements are working?
Track both ranking improvements and business metrics:
- Ranking metrics: Average position, number of green zones, competitor comparisons
- Business metrics: Phone calls, website traffic, foot traffic, sales
- Geographic metrics: Customers from previously weak zones
- Competitive metrics: Market share in different areas
Conclusion: Start Winning Local SEO One Grid at a Time
A 5×5 local SEO heatmap gives you unmatched insight into how your business performs across town. Instead of guessing where you rank or relying on generic metrics, you get a clear, visual representation of your local search dominance.
The businesses that win in local search understand their geographic performance and take action on that knowledge. They do not just optimize for “the city”, they optimize for specific neighborhoods, specific customers, and specific opportunities.
Your heatmap is your competitive advantage. It shows you exactly where to focus your efforts for maximum impact. While your competitors are shooting in the dark, you are making data-driven decisions that actually move the needle.
Remember, local SEO is not about being perfect everywhere, it is about being dominant where it matters most. Use your heatmap to identify those high-value opportunities, then execute consistently until you own those zones.
The best part? Every green zone you create makes the next one easier. Local SEO momentum is real, and heatmaps help you build it systematically.
