
Want to master data journalism but feel overwhelmed by all the tools, skills, and technical jargon? You’re in the right place. This comprehensive guide breaks everything down into simple, actionable steps – no computer science degree required.
Data journalism is experiencing unprecedented growth. News organizations are actively recruiting professionals who can transform complex data into compelling stories that resonate with audiences. According to Glassdoor’s 2025 salary data, data journalists earn between $55,000 to $95,000 annually, with senior professionals commanding even higher compensation. The best part? You don’t need advanced programming skills or a statistics PhD to get started.
This comprehensive guide will walk you through everything you need to know about data journalism in 2025. From understanding fundamental concepts to publishing your first data-driven story, we’ll cover it all in plain English. By the end of this guide, you’ll have a clear roadmap to start your data journalism journey immediately.
What Is Data Journalism and Why Does It Matter?
Data journalism is the practice of discovering, analyzing, and presenting news stories through data analysis. Think of it as investigative reporting enhanced with spreadsheets and visualizations. Instead of relying solely on traditional interviews and observations, data journalists explore databases, surveys, government records, and public datasets to uncover patterns, expose problems, and explain complex societal issues.
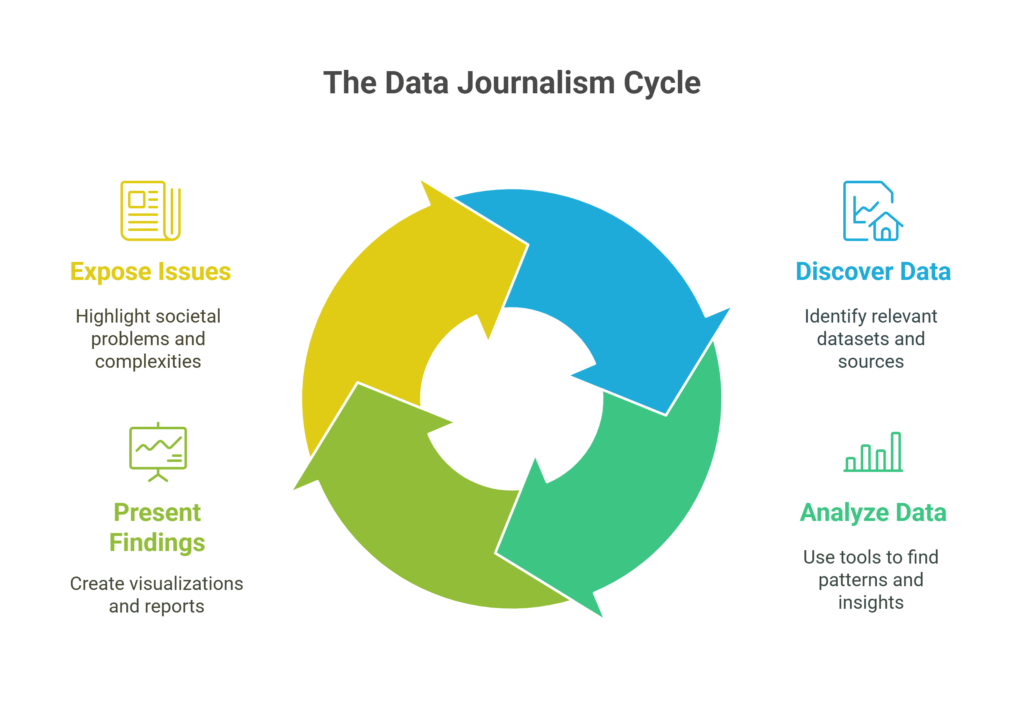
Here’s a practical example to illustrate the concept: Traditional reporting might state “Crime rates increased this year.” Data journalism takes this further by showing exactly which neighborhoods experienced increases, identifying specific crime types that spiked, analyzing temporal patterns, and comparing current data to historical trends using interactive maps and charts.
According to the Pew Research Center’s 2024 State of News Media report, news organizations investing in data journalism capabilities saw 23% higher audience engagement compared to traditional text-only reporting.
Data journalism matters more than ever because:
- Information overload crisis: Society generates 2.5 quintillion bytes of data daily. Someone needs to make sense of it all for the public.
- Misinformation epidemic: Data journalists provide fact-based reporting that cuts through misleading claims and emotional manipulation.
- Government accountability: Public agencies and corporations can’t hide behind vague statements when journalists have documented evidence in spreadsheet form.
- Audience expectations: Modern readers demand proof, not just opinions. They trust stories backed by verifiable data sources.
Some transformative examples of data journalism that changed public policy:
- COVID-19 tracking dashboards: Johns Hopkins University’s coronavirus tracker became the world’s primary pandemic data source, recording over 1 billion visits throughout 2020-2022.
- ProPublica healthcare investigations: Their analysis of Medicare billing data exposed physicians billing for medically impossible procedures, leading to federal investigations.
- Panama Papers investigation: International journalists analyzed 11.5 million leaked documents, revealing global tax evasion schemes and resulting in policy changes across 76 countries.
- Police accountability databases: Local news outlets nationwide have used Freedom of Information Act requests to build databases tracking officer misconduct, leading to departmental reforms.
“Data journalism isn’t about replacing traditional reporting – it’s about making journalism more powerful. The best data stories combine rigorous analysis with compelling human narratives.” – Alberto Cairo, University of Miami
A perfect example: The Washington Post analyzed Washington D.C.’s parking ticket database and discovered the city disproportionately targeted vehicles in low-income neighborhoods. This single data investigation led to policy reforms and saved residents thousands in potentially unfair fines. That demonstrates the transformative power of asking the right questions with the right data.
Essential Skills You Need to Get Started
Don’t worry – you won’t need to become a statistics professor overnight. According to Poynter Institute’s 2024 skills analysis, successful data journalism relies more on curiosity and critical thinking than advanced mathematical calculations. Here are the foundational skills you can start building today:
Basic Statistics Made Simple
You need to understand averages, percentages, and basic comparisons. That’s your starting foundation. Here’s what actually matters:
- Mean versus median: Mean equals all numbers added together, then divided by the count. Median represents the middle number when values are arranged in order. If one billionaire moves to a small town, the mean income skyrockets, but the median barely changes.
- Correlation versus causation: Two events happening simultaneously doesn’t mean one causes the other. Ice cream sales and drowning deaths both increase during summer, but ice cream consumption doesn’t cause drowning incidents.
- Sample size significance: A survey of 10 people provides virtually no reliable insights. A properly conducted survey of 1,000 people can yield statistically significant results.
- Percentage versus percentage points: When unemployment rises from 5% to 7%, that represents a 2 percentage point increase, but a 40% relative increase.
Critical Thinking and Investigative Curiosity
This represents your greatest advantage. Train yourself to ask probing questions:
- Who collected this data and what was their motivation?
- What information is missing from this dataset?
- Who benefits if people believe this particular interpretation?
- What alternative story might this data actually tell?
Data Sourcing and Verification
Data never exists in isolation. You’ll need to master:
- Filing Freedom of Information Act (FOIA) requests effectively
- Building professional relationships with data custodians (government analysts, academic researchers, NGO staff)
- Verifying data collection methodologies and potential biases
- Finding human sources who can explain what numbers actually mean in real-world contexts
Visual Storytelling Fundamentals
Raw numbers bore audiences. Charts, maps, and interactive graphics bring data to life. You don’t need graphic design expertise, but you should understand:
- When to use bar charts versus line charts versus geographic maps
- How to select colors that enhance comprehension rather than create confusion
- Why pie charts typically fail to communicate effectively (seriously, avoid them in most cases)
- How to write clear, descriptive headlines for your visualizations
“The most important skill in data journalism isn’t technical – it’s learning to ask better questions of your data. Technology can be learned, but curiosity and skepticism must be cultivated.” – Sarah Cohen, Arizona State University
Pro Tip: Don’t attempt to master everything simultaneously. Choose one skill from this list and practice using real-world examples. Start with basic Excel functions if you’re comfortable with spreadsheets, or begin with data visualization tools if you’re more visually oriented.
The Essential 2025 Data Journalism Toolkit
Great news: you can begin data journalism using entirely free tools. Even better news: these tools become more user-friendly every year. According to Data Journalism.com’s 2024 tools survey, 67% of working data journalists still use basic spreadsheet software for daily analysis tasks.
Beginner-Friendly Tools You’ll Actually Use
Google Sheets and Microsoft Excel: Perfect for cleaning and organizing manageable datasets
Start here. Every professional data journalist uses spreadsheets daily. Google Sheets offers powerful features including:
- IMPORTHTML function for pulling data directly from websites
- Pivot tables for quickly summarizing large datasets
- Real-time collaboration features for team projects
- Built-in chart creation and customization tools
Flourish: Drag-and-drop data visualizations
This platform revolutionizes visualization creation for beginners. Upload your data, select a chart type, and Flourish generates beautiful, interactive visualizations. Free features include:
- Bar charts, line charts, and scatter plots
- Interactive maps with customizable markers
- Racing bar charts (animated charts showing temporal changes)
- Embed codes for publishing charts on any website
Datawrapper: Professional charts without coding requirements
Major news organizations including The Guardian and Reuters rely on Datawrapper. Key features include:
- Clean, publication-ready chart designs
- Automatic mobile device optimization
- Colorblind-friendly palette options
- One-click sharing and website embedding
AI Tools Transforming Data Journalism in 2025
Artificial intelligence is revolutionizing how journalists work with data. These tools can save hours of manual work:
ChatGPT and GPT-4: Data analysis assistance and content generation
Use AI to:
- Generate complex Excel formulas when you can’t remember syntax
- Brainstorm story angles from existing datasets
- Write first drafts of chart descriptions and headlines
- Explain statistical concepts in accessible language
Claude AI: Advanced pattern recognition and data interpretation
Upload datasets and request AI assistance to:
- Identify significant trends and statistical outliers
- Suggest relevant comparisons and benchmarks
- Generate story ideas based on data patterns
- Review your analysis for potential methodological errors
Canva with AI features: Visual storytelling for social media distribution
Create social media graphics, infographics, and presentation slides with AI assistance:
- AI-generated chart designs and color schemes
- Automatic resizing for different social platforms
- Background removal and image enhancement
- Template suggestions based on your content
Advanced Tools for Skill Development
- Tableau Public: Free version of industry-standard visualization software
- R and RStudio: Open-source programming language for statistical analysis
- Python with Pandas: Programming language with powerful data manipulation libraries
- QGIS: Free mapping software for geographic data analysis
Where to Find Quality Data Sources
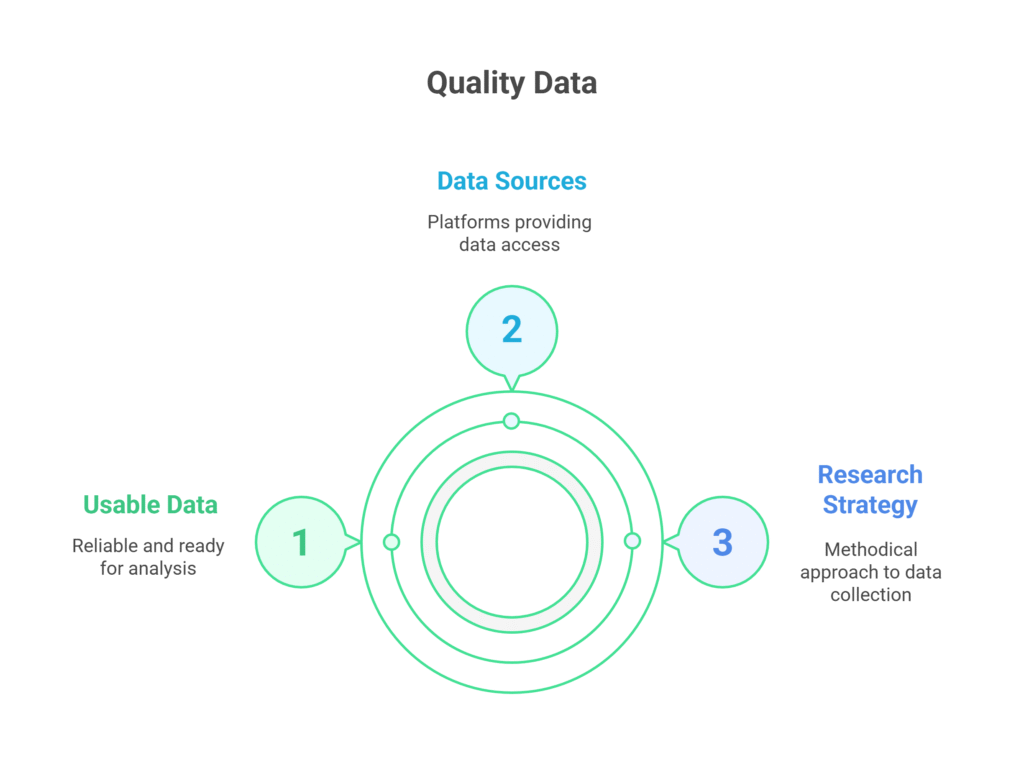
Data exists everywhere, but locating reliable, usable datasets requires strategy and practice. Here’s where to begin your research:
Top Free Data Sources for Beginners
Data.gov: The United States government’s comprehensive open data portal
Contains over 250,000 datasets covering:
- Census data (population demographics, income, housing statistics)
- Weather and climate information
- Federal spending and government contracts
- Public health and safety statistics
- Education data organized by school district
Google Dataset Search: Search engine specifically designed for datasets
This tool searches across thousands of data repositories worldwide. Particularly effective for:
- Academic research datasets
- International comparative data
- Specialized industry statistics
- Historical datasets spanning decades
UN Data and World Bank Open Data: Global statistics and development indicators
Perfect for international stories and cross-country comparisons:
- Economic indicators by country and region
- Social development metrics
- Environmental and climate data
- Demographic trends and projections
Local Government Portals: Your goldmine for community-focused stories
Most cities and counties now maintain online data portals featuring:
- Police incident reports and crime statistics
- Property assessments and real estate transactions
- Restaurant health inspection results
- Building permits and code violations
- Campaign finance records and lobbying disclosures
Hidden Gems for Data Exploration
- ProPublica Data Store: Cleaned, journalism-ready datasets with documentation
- Kaggle: Community-driven datasets perfect for skill development
- Our World in Data: Research-backed global datasets with built-in visualizations
- FiveThirtyEight: Publishes datasets behind their political and sports analyses
- Federal Reserve Economic Data (FRED): Comprehensive economic time series data
“The best datasets are often hiding in plain sight – maintained by organizations that few journalists think to contact. Don’t just look for obvious sources; think about what records organizations must keep to operate legally.” – Cheryl Phillips, Stanford University
Pro Tip: Always verify “Last Updated” dates and source credibility before analysis. Outdated data can mislead readers, and biased sources can skew your interpretation. Document your verification process as part of your methodology.
Step-by-Step Workflow: From Raw Data to Published Story
Here’s the exact methodology professional data journalists follow. These steps will help you avoid the most common analytical pitfalls:
Step 1: Data Discovery and Initial Cleaning
Raw data typically arrives messy. Even government datasets often contain typos, missing values, and inconsistent formatting. Here’s your systematic approach:
Download and Initial Examination:
- Save the original file with today’s date (example: “police_data_2025_01_15_original.csv”)
- Create a working copy for analysis (never modify the original)
- Scroll through the complete dataset to understand its structure
- Document obvious problems (blank cells, impossible values, inconsistent spellings)
Basic Cleaning in Google Sheets:
- Use TRIM() function to eliminate extra spaces
- Apply PROPER() to standardize capitalization
- Sort columns to identify duplicate entries
- Use conditional formatting to highlight statistical outliers
- Create a “methodology notes” column documenting all changes
Step 2: Pattern Analysis and Story Discovery
This phase involves investigative detective work. You’re searching for trends, outliers, and comparisons that suggest compelling narratives:
Essential Functions to Master:
- AVERAGE() to identify typical values and baselines
- MAX() and MIN() to find extreme cases
- COUNTIF() to count occurrences meeting specific criteria
- SUMIF() to total values under certain conditions
Story Types to Investigate:
- Temporal trends: Is something increasing, decreasing, or cyclical?
- Geographic patterns: Do certain areas show different outcomes?
- Demographic disparities: Do results vary by age, race, income, or education?
- Seasonal variations: Do patterns change by month, season, or annual cycles?
- Statistical outliers: What appears unusual or unexpected?
Step 3: Finding Human Stories Within Numbers
Data without human context remains merely numbers. Transform statistics into compelling narratives:
Critical Questions to Ask:
- Who is directly affected by these statistical trends?
- What real-world events might explain these data patterns?
- Which communities or individuals represent the statistical outliers?
- What consequences might result if these trends continue?
Source Development Strategy:
- People represented in your dataset (survey respondents, service recipients, affected individuals)
- Subject matter experts who can interpret statistical significance
- Officials responsible for programs or policies reflected in the data
- Community advocates working directly with affected populations
Step 4: Visual and Narrative Integration
The most effective data stories seamlessly combine clear visualizations with compelling human narratives:
Chart Selection Guidelines:
- Line charts: Demonstrate changes over time periods
- Bar charts: Compare different categories or groups
- Maps: Show geographic patterns and regional variations
- Scatter plots: Illustrate relationships between two variables
Headline Writing Best Practices:
- “Violent Crime Drops 15% in Downtown District Since Policy Changes”
- “Property Tax Increases Hit Low-Income Neighborhoods Hardest”
- “Achievement Gap Widens Between Suburban and Urban School Districts”
Step 5: Mobile-First Publication and Distribution
According to Statista’s 2025 mobile usage report, 58.67% of web traffic comes from mobile devices. Design your data stories accordingly:
Content Structure for Mobile:
- Short paragraphs (maximum 2-3 sentences)
- Bullet points for complex information
- Descriptive subheadings every 3-4 paragraphs
- Key findings highlighted in pull quotes or callout boxes
Visual Design Considerations:
- Vertical charts display better on mobile screens than horizontal layouts
- Square visualizations optimize for social media sharing
- Large, readable fonts ensure accessibility
- Limit charts to 5-7 data points maximum for clarity
Building Your Data Journalism Career
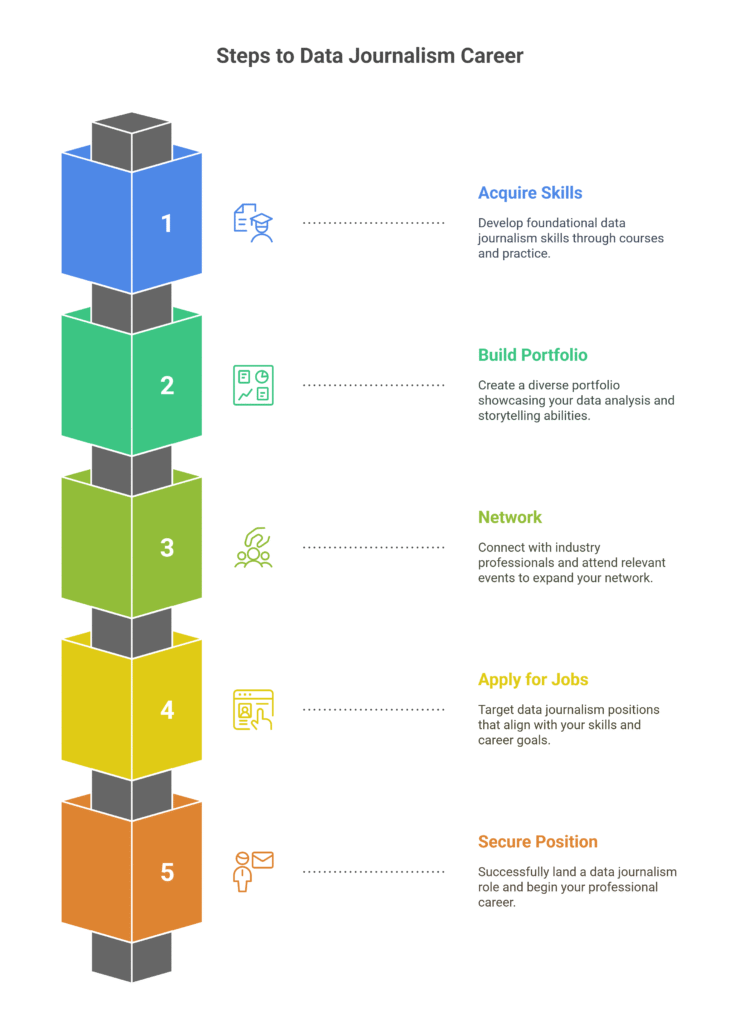
Ready to transform your new skills into a professional career? Here’s a strategic approach to building expertise and securing your first data journalism position:
Recommended Learning Paths and Certifications
Knight Center for Journalism (Free Online Education)
The gold standard for journalism education offers comprehensive free courses:
- “Introduction to Data Journalism” (4-week course, completely free)
- “Data Visualization for Digital Storytelling” (self-paced learning)
- “Investigative Reporting in the Digital Age”
- “Artificial Intelligence for Journalists” (updated for 2025)
Google News Initiative Training Platform
Free courses developed specifically for working journalists:
- “Finding and Verifying Information Online”
- “Introduction to Machine Learning for News Organizations”
- “Advanced Data Journalism Techniques”
- “Fact-checking at Scale Using Technology”
Career Opportunities and Salary Expectations
Data journalism skills open multiple career pathways:
Data Journalist ($45,000 – $85,000 annually)
- Create data-driven stories for news organizations
- Build and maintain investigative databases
- Collaborate with reporters and editors on complex investigations
Newsroom Data Analyst ($50,000 – $90,000 annually)
- Support multiple reporters with analytical assistance
- Maintain newsroom databases and research resources
- Train colleagues in data analysis techniques
Investigative Reporter ($55,000 – $100,000+ annually)
- Use data analysis for long-form investigative journalism
- Develop government and institutional sources
- Lead multi-month projects with significant public impact
Portfolio Development Strategy
Three Resume-Building Project Ideas:
- Local Election Analysis: Analyze voting patterns in your city’s recent election, creating maps showing turnout by precinct and demographics.
- Restaurant Safety Tracker: Build a searchable database of health department restaurant inspections, identifying trends and potential problems.
- Housing Market Investigation: Analyze real estate sales data to identify which neighborhoods are experiencing rapid gentrification.
Portfolio Best Practices:
- Create a simple website or GitHub portfolio showcasing your work
- Include both final stories and detailed methodology explanations
- Document your analytical process, including challenges and solutions
- Show skill progression across multiple projects
- Include screenshots of your data analysis, not just final visualizations
Frequently Asked Questions
What’s the best way to learn data journalism as a complete beginner?
Start with one simple project using easily accessible data. Choose a local issue you care about, find relevant public data, and try to answer one specific question. For example: “Which streets in my neighborhood receive snow plowing priority?” Use basic tools like Google Sheets and Datawrapper. Focus on starting, not achieving perfection immediately.
Supplement hands-on practice with the Knight Center’s free “Introduction to Data Journalism” course for structure and community connection.
Do I need programming skills to get started?
Absolutely not. Many successful data journalists never write code. You can create compelling data stories using only spreadsheets and drag-and-drop visualization tools like Flourish or Datawrapper.
However, learning basic programming (especially Python or R) will expand your capabilities as you advance. Consider coding a power tool – helpful but not required for building your foundation.
How long does it take to learn the fundamentals?
You can publish your first data story within 2-4 weeks with consistent practice. Becoming proficient enough for entry-level positions typically requires 3-6 months of regular skill development.
Realistic timeline:
- Weeks 1-2: Master spreadsheet basics and create your first simple chart
- Weeks 3-4: Complete your first mini data investigation
- Months 2-3: Build portfolio with 2-3 completed projects
- Months 4-6: Develop specialization and apply for positions
What’s the biggest mistake beginners make?
Attempting to analyze datasets that are too large or complex for current skill levels. Start small and build confidence systematically. A compelling story about 50 local businesses surpasses getting overwhelmed by a database containing 50,000 records.
How do I verify my data analysis is accurate?
Always double-check your methodology and seek peer review. Essential practices include:
- Document every analytical step for transparency
- Test conclusions with sample data subsets
- Interview subject matter experts to verify findings
- Be transparent about limitations and uncertainties
Your Next Steps
You don’t need advanced mathematical expertise or programming mastery to start telling powerful stories with data. The most critical qualities are curiosity, persistence, and commitment to accuracy. Data journalism combines traditional investigative reporting with clear visual storytelling.
The field continues growing rapidly. News organizations, nonprofit institutions, and government agencies actively seek professionals who can analyze data and communicate findings effectively to public audiences.
Remember: every expert started as a beginner. The data journalists you admire began exactly where you are now. The difference lies in taking the first step.
Your initial story won’t achieve perfection, and that’s completely acceptable. Each project teaches valuable lessons. Focus on asking insightful questions, finding reliable data sources, and telling stories that matter to your community. Data journalism represents more than a career skill – it’s a method for strengthening democracy by helping citizens understand their world better.
